Definition of Regression
Regression refers to a statistical method used to analyze the relationship between variables. It involves finding a mathematical equation or model that best describes the relationship between a dependent variable and one or more independent variables. The purpose of regression analysis is to make predictions or estimate the value of the dependent variable based on the values of the independent variables. Regression analysis can be used for both linear and nonlinear relationships.
Types of Regression
Regression analysis is a statistical method used to predict the value of a dependent variable based on the values of one or more independent variables. There are various types of regression techniques, depending on the nature of the data and the relationship between the variables. Some common types of regression include:
1. Simple Linear Regression: This is the most basic form of regression that involves a single dependent variable and a single independent variable. It assumes a linear relationship between the variables.
2. Multiple Linear Regression: This form of regression involves more than one independent variable to predict a dependent variable. It assumes a linear relationship between the dependent variable and the independent variables.
3. Polynomial Regression: This type of regression allows for nonlinear relationships by including polynomial terms of the independent variables. It fits a curved line to the data points.
4. Logistic Regression: Unlike linear regression, logistic regression is used when the dependent variable is categorical or binary. It predicts the probability of an event occurring based on the independent variables.
5. Ridge Regression: Ridge regression is a regularized version of linear regression that includes a penalty term to minimize overfitting. It helps in handling multicollinearity, a situation where independent variables are highly correlated.
6. Lasso Regression: Lasso regression is another regularization technique that adds a penalty term to linear regression. It not only minimizes overfitting but also performs feature selection by shrinking some coefficients to zero.
7. Support Vector Regression (SVR): SVR is a regression technique that uses support vector machines to predict the continuous outcome. It works by finding a hyperplane that maximizes the margin between the predicted values and the actual values.
8. Time Series Regression: Time series regression is used when the dependent and independent variables are collected over time. It helps in forecasting future values based on historical patterns.
These are just a few examples of regression techniques, and there are many more variations and extensions available depending on the specific requirements of the analysis.
Regression in Statistics
Regression in statistics refers to a statistical technique used to model the relationship between a dependent variable and one or more independent variables. It is commonly used in many fields, including economics, finance, social sciences, and medicine.
The goal of regression analysis is to identify and quantify the relationship between the variables, as well as to make predictions or understand the impact of changes in the independent variables on the dependent variable. The dependent variable is also known as the response or outcome variable, while the independent variables are known as predictor or explanatory variables.
There are different types of regression models, including linear regression, logistic regression, polynomial regression, and multiple regression. In simple linear regression, the relationship between the dependent variable and a single independent variable is represented by a straight line. In multiple regression, two or more independent variables are used to predict the dependent variable.
Regression analysis typically involves estimating the parameters of the regression equation, which define the slope and intercept of the line or curve that best fits the data. This is done using statistical techniques such as the method of least squares.
Once the regression model is estimated, it can be used for prediction, inference, or hypothesis testing. For example, regression analysis can be used to predict future sales based on advertising expenditure, to test whether a certain variable has a significant effect on an outcome, or to estimate the impact of a policy change on an economic indicator.
Regression analysis has various assumptions, such as linearity, independence of errors, and constant variance of errors. Violation of these assumptions can affect the validity of the regression results and may require the use of alternative regression techniques or additional diagnostic tests.
In summary, regression in statistics is a powerful tool used to model and analyze the relationship between variables. It helps in understanding and predicting the behavior of the dependent variable based on the independent variables, making it widely used in various fields of research and decision-making.
Applications of Regression
Regression analysis is a statistical technique used to model and analyze the relationship between a dependent variable and one or more independent variables. It is widely used in various fields and has numerous applications. Some of the common applications of regression analysis include:
1. Predictive modeling: Regression analysis is commonly used for predicting or forecasting future values of a dependent variable based on historical data of independent variables. For example, sales forecasting, stock market prediction, weather forecasting, and demand forecasting all utilize regression models to predict future outcomes.
2. Marketing and sales analysis: Regression analysis helps in understanding the impact of marketing efforts on sales and customer behavior. It can be used to measure the effectiveness of advertising campaigns, pricing strategies, and promotional activities. By analyzing the relationship between sales and various marketing variables, companies can optimize their marketing strategies.
3. Financial analysis: Regression analysis is widely used in finance for various purposes. It can be used to model the relationship between stock prices and factors such as interest rates, economic indicators, and corporate financial ratios. It is also used in portfolio management to estimate the risk of investments and analyze the relationship between risk and return.
4. Economics: Regression analysis is extensively used in economics to study the relationship between economic variables and to estimate economic models. It can be used to analyze the impact of factors like inflation, interest rates, government policies, and other macroeconomic variables on economic indicators such as GDP, employment, and inflation rates.
5. Healthcare analysis: Regression analysis is used in healthcare research to study the relationship between independent variables (such as age, gender, lifestyle, genetics) and health outcomes like disease occurrence, mortality rates, and patient responses to treatments. This helps in identifying risk factors, understanding disease patterns, and developing effective healthcare interventions.
6. Social sciences: Regression analysis is widely used in social sciences, including psychology, sociology, and education research. It helps in understanding the relationship between independent variables (such as demographics, behavior, attitudes) and dependent variables (such as academic achievement, job satisfaction, crime rates) to make predictions and draw conclusions.
Overall, regression analysis is a versatile statistical technique that can be applied to various fields for understanding relationships, making predictions, and analyzing data. Its application extends beyond the mentioned examples to any scenario where there is a need to model and analyze the relationship between variables.
Limitations of Regression
Regression analysis, while a widely used statistical method, has several limitations that researchers should be aware of. Some of the limitations of regression analysis are:
1. Linearity assumption: Regression assumes a linear relationship between the independent variables and the dependent variable. If the relationship is non-linear, the results may not be accurate.
2. Multicollinearity: Multicollinearity occurs when two or more independent variables in the regression model are highly correlated. This can lead to unstable coefficient estimates and difficulty in interpreting the individual effects of each variable.
3. Autocorrelation: Autocorrelation refers to the presence of correlation between the error terms of a regression model. It violates the assumption of independence of observations, which can lead to inefficient and biased coefficient estimates.
4. Heteroscedasticity: Heteroscedasticity occurs when the variability of the error term is not constant across different levels of the independent variables. This violates the assumption of homoscedasticity, which can result in inefficient and unreliable standard errors.
5. Outliers and influential observations: Outliers are extreme values that can significantly impact the estimated coefficients and overall model fit. Influential observations have a large impact on the results due to their extreme values or leverage. These observations can distort the regression analysis.
6. Causality: Regression analysis can show associations between variables, but it cannot establish causality. Other factors may be involved in the relationship observed, and there is always the possibility of reverse causality or lurking variables.
7. Data limitations: Regression analysis is sensitive to the quality and quantity of the data available. Insufficient data or missing data can lead to biased results or reduced statistical power.
8. Extrapolation: Regression models are often used for prediction, but they should be used with caution when extrapolating beyond the range of the observed data. Extrapolation relies on the assumption that the relationship between variables remains the same outside the observed range, which may not always be valid.
It is important to understand these limitations and consider them when using regression analysis for data analysis and interpretation.
Topics related to Regression
How To… Perform Simple Linear Regression by Hand – YouTube

How To… Perform Simple Linear Regression by Hand – YouTube
Simple Linear Regression(Part A) – YouTube

Simple Linear Regression(Part A) – YouTube
Simple Linear Regression (Part B) – YouTube

Simple Linear Regression (Part B) – YouTube
Linear Regression From Scratch in Python (Mathematical) – YouTube

Linear Regression From Scratch in Python (Mathematical) – YouTube
Introduction to Regression – Correlation and Regression – Engineering Mathematics 3 – YouTube

Introduction to Regression – Correlation and Regression – Engineering Mathematics 3 – YouTube
Linear Regression Using Least Squares Method – Line of Best Fit Equation – YouTube
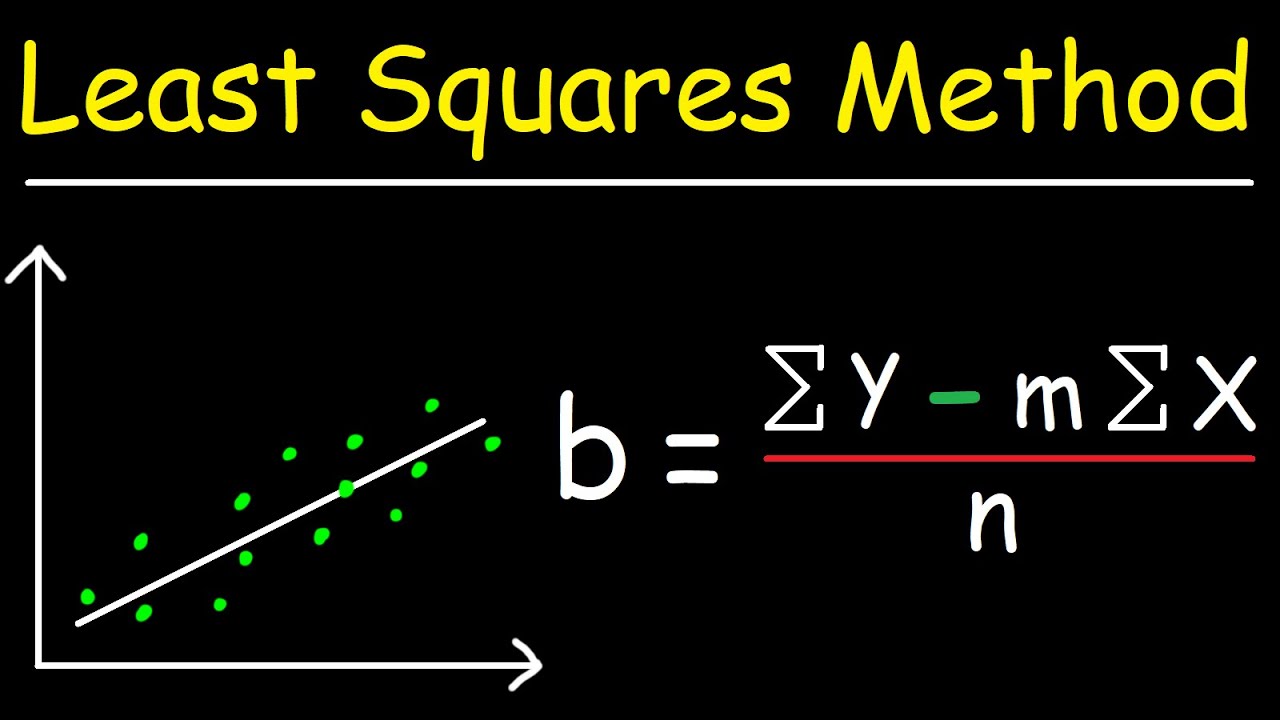
Linear Regression Using Least Squares Method – Line of Best Fit Equation – YouTube
Linear Regression in 2 minutes – YouTube

Linear Regression in 2 minutes – YouTube
Correlation Coefficient | Correlation Coefficient Example | Statistics – YouTube

Correlation Coefficient | Correlation Coefficient Example | Statistics – YouTube
Rank Correlation | Rank Correlation Coefficient | Spearman Rank Correlation – YouTube

Rank Correlation | Rank Correlation Coefficient | Spearman Rank Correlation – YouTube
Regression: Crash Course Statistics #32 – YouTube

Regression: Crash Course Statistics #32 – YouTube

Peter Scholze is a distinguished German mathematician born on December 11, 1987. Widely recognized for his profound contributions to arithmetic algebraic geometry, Scholze gained international acclaim for his work on perfectoid spaces. This innovative work has significantly impacted the field of mathematics, particularly in the study of arithmetic geometry. He is a leading figure in the mathematical community.