Overview of Principal Component Analysis (PCA)
Principal Component Analysis (PCA) is a statistical technique used to simplify and understand complex datasets by reducing their dimensionality. It is widely used in various fields, including data analysis, pattern recognition, and machine learning.
The basic idea behind PCA is to transform high-dimensional data into a lower-dimensional space while retaining as much information as possible. This is achieved by finding a set of new variables, called principal components, which are linear combinations of the original variables.
The principal components are sorted in such a way that the first component captures the maximum variance in the data, the second component captures the second largest variance, and so on. Therefore, PCA allows us to rank the importance of different variables and identify the most significant patterns or features in the data.
PCA also provides a way to visualize the data in a reduced-dimensional space. By plotting the data points based on their scores on the principal components, we can gain insights into the underlying structure and relationships in the data.
Some of the key applications of PCA include data compression, feature extraction, and data visualization. It can help in simplifying complex datasets, identifying key features, removing noise, and improving the efficiency of machine learning algorithms.
However, it is important to note that PCA assumes linearity in the data and may not be appropriate for all datasets. Additionally, the interpretation of the principal components may not always be straightforward, especially when dealing with high-dimensional data.
In summary, PCA is a powerful technique for dimensionality reduction and data exploration. It helps in simplifying complex datasets and identifying the most important patterns or features. By transforming the data into a reduced-dimensional space, PCA provides a way to visualize and understand the underlying structure in the data.
Basic principles and concepts of PCA
PCA, or Principal Component Analysis, is a statistical technique used for dimensionality reduction and data visualization. It helps in identifying the most important features or patterns in a dataset by transforming the original variables into a new set of uncorrelated variables called principal components. Here are some basic principles and concepts of PCA:
1. Variance and Covariance: PCA analyzes the covariance structure of a dataset. It measures the spread and relationships between variables. Variables with high variances contribute more to the overall dataset structure, and variables with high covariances are related to each other.
2. Eigenvalues and Eigenvectors: Once the covariance matrix of the dataset is computed, PCA finds its eigenvalues and eigenvectors. Eigenvectors represent the directions or axes of maximum variance in the dataset. Eigenvalues indicate the amount of variance explained by each eigenvector. Higher eigenvalues correspond to more important principal components.
3. Principal Components: These are calculated as linear combinations of the original variables in a way that they maximize the variance in the dataset. The first principal component captures the maximum amount of variance, the second one captures the remaining variance not explained by the first component, and so on. Each principal component is orthogonal to the others, meaning they are uncorrelated.
4. Explained Variance Ratio: The proportion of the total variance explained by each principal component is known as the explained variance ratio. It represents the amount of information retained by including that particular principal component. This helps in determining the number of principal components to retain.
5. Dimensionality Reduction: PCA can be used for dimensionality reduction by selecting a subset of the principal components that retain most of the variance. This reduces the number of variables or features while preserving the key information from the original dataset.
6. Data Visualization: PCA also facilitates data visualization in a lower-dimensional space. By projecting the data onto the principal components’ axes, it transforms the high-dimensional data into a lower-dimensional representation. This representation can be visualized in scatter plots or other techniques to gain insights into the structure and patterns of the data.
Overall, PCA is a powerful tool for feature extraction, dimensionality reduction, and data visualization. It aids in reducing complexity, removing redundant information, and identifying the most important patterns in a dataset.
Steps involved in performing PCA
Principal Component Analysis (PCA) is a popular dimensionality reduction technique used in data analysis. The steps involved in performing PCA are as follows:
1. Standardize the data: PCA is sensitive to the scale of the variables, so it is important to standardize the data by subtracting the mean and scaling to unit variance. This step ensures that all variables are on a similar scale.
2. Compute the covariance matrix: The next step is to compute the covariance matrix of the standardized data. The covariance matrix represents the relationship between different variables and is used to determine the principal components.
3. Calculate the eigenvectors and eigenvalues: Eigenvectors and eigenvalues are calculated from the covariance matrix. The eigenvectors represent the principal components, and the eigenvalues represent the amount of variance explained by each principal component. Higher eigenvalues correspond to more important principal components.
4. Sort the eigenvectors: Sort the eigenvectors in descending order based on their eigenvalues. This will help identify the most important principal components that explain the most variance in the data.
5. Select the number of principal components: Decide how many principal components to retain based on the eigenvalues. A common approach is to choose the number of components that explain a significant amount of the variance in the data, such as 80-90%.
6. Create the projection matrix: The projection matrix is created by selecting the top k eigenvectors, where k is the number of principal components selected in the previous step. This matrix helps transform the data into the new lower-dimensional space.
7. Project the data: Multiply the standardized data by the projection matrix to obtain the transformed data in the reduced-dimensional space. This step maps the original variables onto the new principal components.
8. Interpret the results: Analyze the transformed data to understand how the principal components relate to the original variables. Principal components with higher loadings on certain variables indicate a stronger relationship between the variables.
By following these steps, PCA can effectively reduce the dimensionality of the data while retaining the most important information.
Applications and uses of PCA
Principal Component Analysis (PCA) is a widely used dimensionality reduction technique that finds its application in various fields. Here are some of the common applications and uses of PCA:
1. Data Visualization: PCA is employed to visualize high-dimensional data in a lower-dimensional space. By reducing the data to its principal components, PCA can generate scatter plots or 3D plots that help in visualizing patterns and relationships in the data.
2. Pattern Recognition: PCA aids in identifying significant patterns or features in the dataset. It can be used as a preprocessing step for machine learning algorithms by reducing the dimensionality and removing redundant or irrelevant features, leading to improved accuracy and reduced computational workload.
3. Image Processing: PCA is utilized in image compression and reconstruction techniques. By identifying the most important features using PCA, it is feasible to represent an image using fewer components, thereby reducing storage requirements while retaining a reasonably accurate representation of the original image.
4. Genetics and Genomics: PCA helps in genetic data analysis by identifying the principal components that explain the most significant variations in the dataset. This information can be utilized for dimensional reduction, data clustering, and identifying genetic markers associated with certain traits or diseases.
5. Face Recognition: PCA has been extensively employed in facial recognition systems. By extracting the principal components associated with faces from a large dataset, PCA can create a face space that allows efficient face detection and recognition.
6. Financial Analysis: In finance, PCA is utilized for portfolio optimization and risk management. It enables the identification of key factors that influence asset prices, finding portfolios with low correlation, and reducing the dimensionality of financial data for efficient analysis.
7. Signal Processing: PCA is implemented in signal denoising and feature extraction. By decomposing signals into their principal components using PCA, it becomes easier to filter out noise and extract the underlying important features.
8. Natural Language Processing: PCA finds its application in text analysis and document classification. It helps in reducing the dimensionality of the data and identifying the most informative features for accurate and efficient text processing.
These are just a few examples of the wide range of applications and uses of PCA. The technique proves beneficial whenever dimensionality reduction, data visualization, or feature extraction is required.
Limitations and considerations in PCA
There are several limitations and considerations in Principal Component Analysis (PCA) that should be taken into account:
1. Linearity assumption: PCA assumes that the relationships between variables are linear. If the relationships are non-linear, PCA may not provide an accurate representation of the data.
2. Variance-based method: PCA is primarily focused on maximizing the variance in the data. Therefore, it may not be suitable for analysing data sets where other aspects, such as outliers or specific patterns, are of interest.
3. Sensitivity to scaling: PCA is sensitive to the scaling of variables. If the variables have different scales, it is important to scale them before performing PCA. Otherwise, variables with larger scales will dominate the principal components.
4. Outliers: PCA can be sensitive to outliers, which are extreme values that deviate significantly from the rest of the data set. Outliers can influence the calculation of principal components and therefore, their removal or proper handling is essential.
5. Dimensionality reduction: PCA is often used for dimensionality reduction, but it does not guarantee that the retained principal components will have meaningful interpretations. It is important to interpret and evaluate the retained components carefully.
6. Interpretability: Although PCA can reduce data dimensions and identify patterns, the resulting principal components may not always have a clear and meaningful interpretation. They are typically combinations of the original variables, and their interpretation may require additional analysis.
7. Multicollinearity: PCA assumes that the variables are uncorrelated. If there is multicollinearity (high correlation) between variables, the interpretation of the principal components may be more difficult, and their explanatory power may be reduced.
8. Data outliers vs feature outliers: Data outliers are observations that lie far away from the majority of the data points. Feature outliers refer to variables that are significantly different from others. PCA can handle data outliers, but feature outliers can affect the derived principal components.
9. Sample size: PCA methods can be affected by the size of the data set. If the sample size is small, the derived principal components may not be reliable or representative of the underlying population.
10. Data distribution: PCA assumes that the data is normally distributed. Therefore, if the data follows a non-normal distribution, additional techniques may be more appropriate for dimensionality reduction or analysis.
It is important to address these limitations and considerations, and to assess whether PCA is an appropriate analysis technique for a given data set or research question.
Topics related to Principal Component Analysis (PCA)
StatQuest: Principal Component Analysis (PCA), Step-by-Step – YouTube
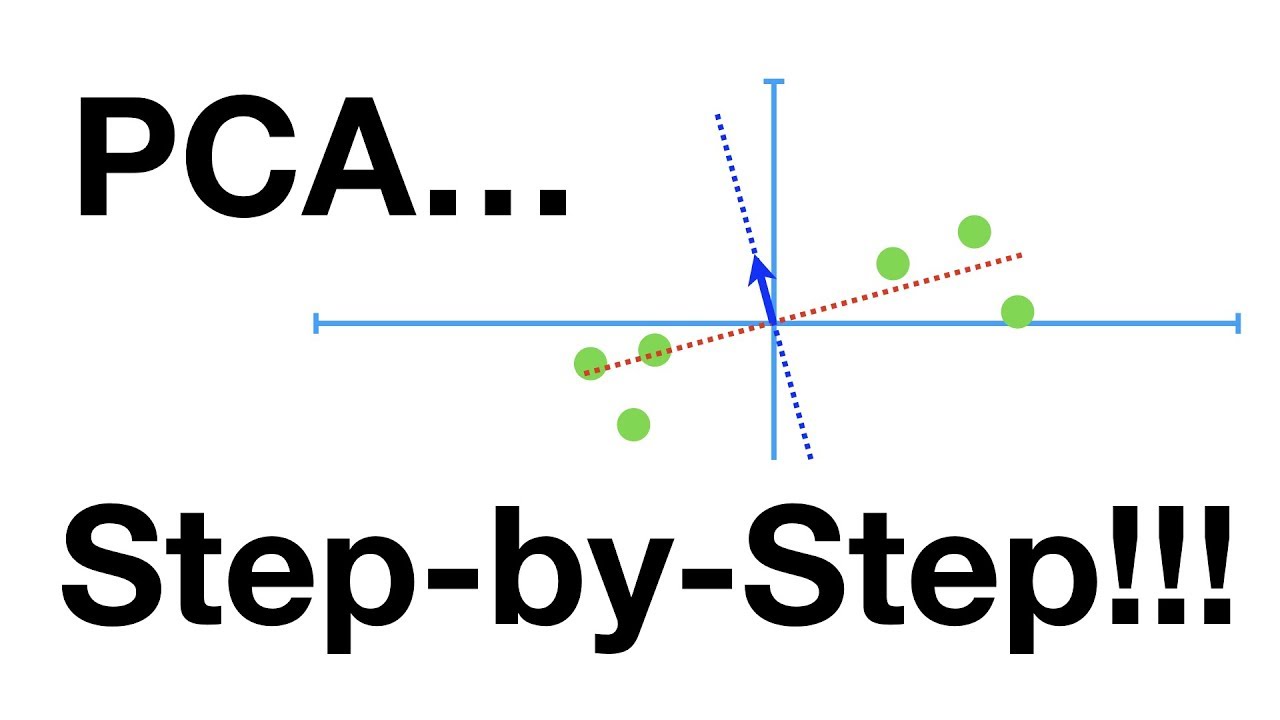
StatQuest: Principal Component Analysis (PCA), Step-by-Step – YouTube
Principal Component Analysis (PCA) – YouTube
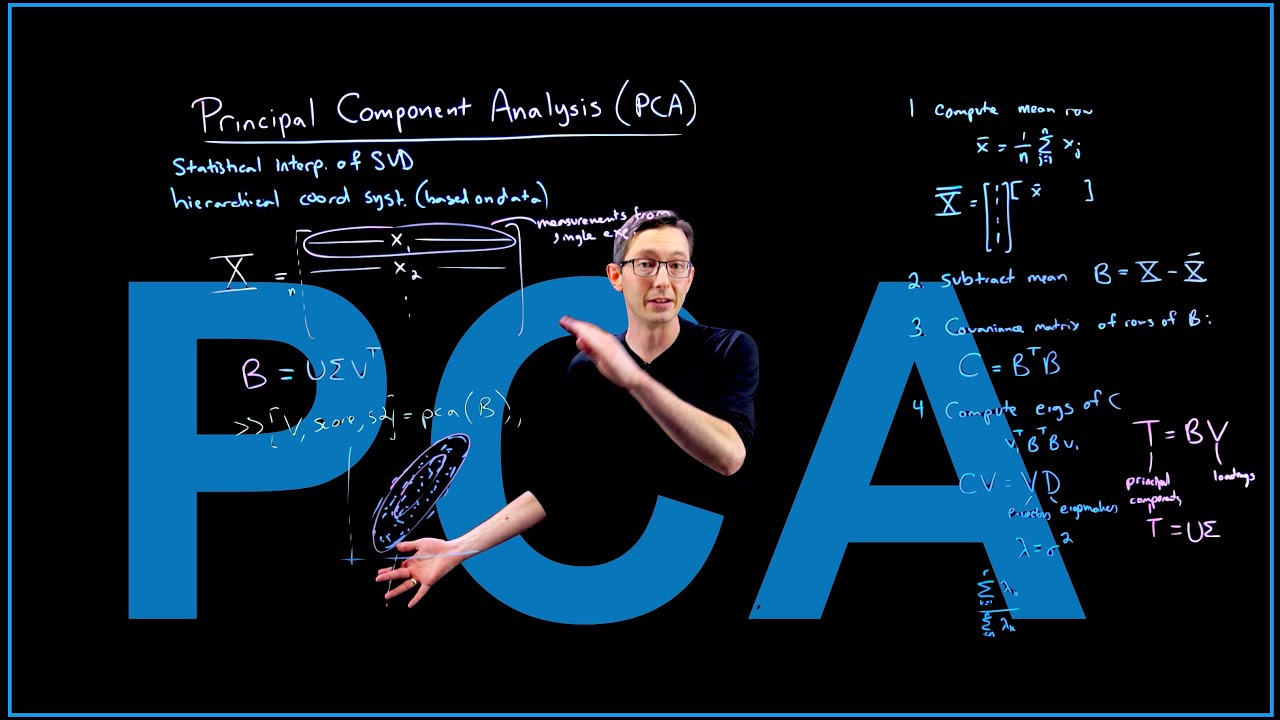
Principal Component Analysis (PCA) – YouTube
Principal Component Analysis (PCA) – THE MATH YOU SHOULD KNOW! – YouTube
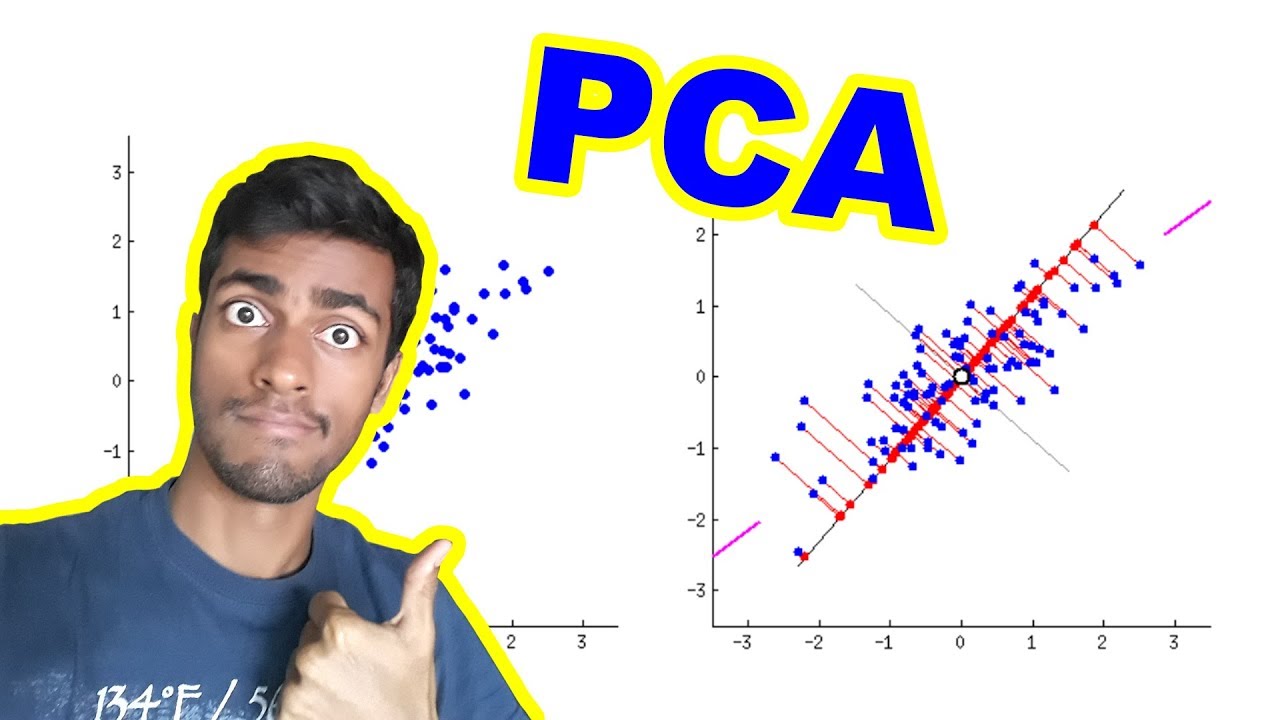
Principal Component Analysis (PCA) – THE MATH YOU SHOULD KNOW! – YouTube
PCA : the math – step-by-step with a simple example – YouTube

PCA : the math – step-by-step with a simple example – YouTube
StatQuest: PCA main ideas in only 5 minutes!!! – YouTube

StatQuest: PCA main ideas in only 5 minutes!!! – YouTube
Principal Component Analysis (PCA) Maths Explained with Implementation from Scratch – YouTube

Principal Component Analysis (PCA) Maths Explained with Implementation from Scratch – YouTube
Principal Component Analysis (The Math) : Data Science Concepts – YouTube

Principal Component Analysis (The Math) : Data Science Concepts – YouTube
Principal Component Analysis (PCA) – YouTube

Principal Component Analysis (PCA) – YouTube
Principal Component Analysis (PCA) – easy and practical explanation – YouTube

Principal Component Analysis (PCA) – easy and practical explanation – YouTube
Principal Component Analysis in R Programming | How to Apply PCA | Step-by-Step Tutorial & Example – YouTube

Principal Component Analysis in R Programming | How to Apply PCA | Step-by-Step Tutorial & Example – YouTube

Peter Scholze is a distinguished German mathematician born on December 11, 1987. Widely recognized for his profound contributions to arithmetic algebraic geometry, Scholze gained international acclaim for his work on perfectoid spaces. This innovative work has significantly impacted the field of mathematics, particularly in the study of arithmetic geometry. He is a leading figure in the mathematical community.