Definition of T-distribution
The t-distribution, also known as Student’s t-distribution, is a probability distribution that is used to estimate a population parameter when the sample size is small and the population standard deviation is unknown. It is similar to the normal distribution but has heavier tails, meaning it allows for more variability in the data.
The t-distribution is characterized by its degrees of freedom, which represents the sample size minus one. As the degrees of freedom increase, the t-distribution becomes more similar to the standard normal distribution.
The t-distribution is commonly used in hypothesis testing and constructing confidence intervals. It provides critical values that can be used to determine whether a sample mean is significantly different from a hypothesized population mean.
Overall, the t-distribution is a valuable statistical tool that allows for more accurate inference when dealing with small sample sizes or limited knowledge about population parameters.
Properties of T-distribution
The T-distribution, also known as the Student’s T-distribution, is a probability distribution that is used in statistical inference when the sample size is small and the population standard deviation is unknown. It is similar to the normal distribution but has heavier tails, which means that it allows for more variability in the data.
Characteristics and properties of the T-distribution include:
1. Shape: The T-distribution is a symmetric, bell-shaped distribution with a mean of zero. However, the shape of the distribution is influenced by the degrees of freedom (df), which determines the spread and thickness of the tails. As the degrees of freedom increase, the T-distribution approaches the shape of the standard normal distribution.
2. Degrees of freedom: Degrees of freedom represent the number of independent observations in a sample. In the T-distribution, the degrees of freedom represent the sample size minus one (df = n – 1). The larger the sample size, the larger the degrees of freedom, and the closer the T-distribution is to the normal distribution.
3. Spread and variability: The T-distribution has more spread and variability compared to the normal distribution, especially in the tails. This means that extreme values are more likely to occur in a T-distribution compared to a normal distribution.
4. Confidence intervals: The T-distribution is commonly used to construct confidence intervals for parameter estimation. When the population standard deviation is unknown, the T-distribution is used to calculate the margin of error around the sample mean.
5. Hypothesis testing: The T-distribution is used in hypothesis testing when the population standard deviation is unknown. It is used to calculate the t-statistic, which is then compared to critical values in order to make a decision about the null hypothesis.
6. Connection to sample mean: The T-distribution allows for the estimation of the population mean based on a sample mean. It characterizes the uncertainty of the estimate and provides a range of possible values.
In summary, the T-distribution is a useful statistical tool when working with small sample sizes or when the population standard deviation is unknown. It accounts for the increased variability and uncertainty in the data, providing a more realistic representation of the population.
Relationship between T-distribution and normal distribution
The t-distribution is a probability distribution that arises when working with small sample sizes or when population standard deviation is unknown. The relationship between the t-distribution and the normal distribution is that the t-distribution approaches the standard normal distribution (a special case of the normal distribution with mean 0 and standard deviation 1) as the sample size increases.
Specifically, as the sample size (n) increases, the t-distribution becomes more similar in shape to the normal distribution. When the sample size is large enough (typically n > 30), the t-distribution is nearly indistinguishable from the normal distribution.
However, when dealing with smaller sample sizes, the t-distribution is wider and has heavier tails compared to the normal distribution. This means that there is more variability in the t-distribution compared to the normal distribution, and it captures the uncertainty associated with estimating the population parameter based on a small number of observations.
The t-distribution is characterized by a parameter known as degrees of freedom (df), which determines its shape. As the degrees of freedom increase, the t-distribution becomes closer to the normal distribution. In fact, when the degrees of freedom approach infinity, the t-distribution converges to the standard normal distribution.
In summary, the t-distribution is closely related to the normal distribution, but it accounts for the additional uncertainty that arises from working with small sample sizes or unknown population standard deviation. As the sample size increases, the t-distribution approaches the normal distribution, ultimately converging to it when the sample size becomes large enough.
Application of T-distribution in hypothesis testing
The t-distribution is a probability distribution that is used in statistics for hypothesis testing when the sample size is small or when the population standard deviation is unknown. It is commonly used when conducting hypothesis tests on the mean of a population.
One example of the application of the t-distribution in hypothesis testing is in comparing the means of two different populations. In this scenario, the t-distribution can be used to determine if there is a significant difference between the means of the two groups. The hypotheses would be formulated as:
Null hypothesis (H0): The means of the two populations are equal.
Alternative hypothesis (Ha): The means of the two populations are not equal.
By calculating the t-statistic using the sample means, sample standard deviations, and sample sizes, we can determine the probability of obtaining a difference as extreme as the one observed if the null hypothesis is true. This probability is compared to a predetermined significance level (usually 0.05) to make a decision to either reject or fail to reject the null hypothesis.
Another application of the t-distribution is in testing whether a sample mean differs significantly from a known or hypothesized population mean. For example, if we want to test if the average weight of a sample of individuals is significantly different from a certain value, we can use the t-distribution to calculate the probability of obtaining that sample mean if the true population mean is equal to the hypothesized value.
In both cases, the t-distribution is used to calculate the critical values or p-values to make decisions about the null hypothesis. The critical values are used to determine the rejection region, while the p-value is the probability of observing a test statistic as extreme or more extreme than the one calculated from the data.
Overall, the t-distribution provides a valuable tool for hypothesis testing when certain assumptions about the population are not met or when the sample size is small. It allows for more accurate inference about population parameters and helps determine if the observed results are due to chance or if there is a significant effect.
Calculation and interpretation of T-statistic
The T-statistic is a measure that is used in hypothesis testing to determine the significance of a particular sample statistic. It is calculated by taking the difference between the sample mean and the hypothesized population mean, and dividing it by the standard error of the sample mean.
The T-distribution, on the other hand, is a probability distribution that is used specifically for making inferences about population means when the sample size is small or when the population standard deviation is unknown.
To calculate the T-statistic, you would first need to have the sample mean, the hypothesized population mean, and the standard error of the sample mean. The formula for the calculation is:
T-statistic = (sample mean – population mean) / (standard error of the sample mean)
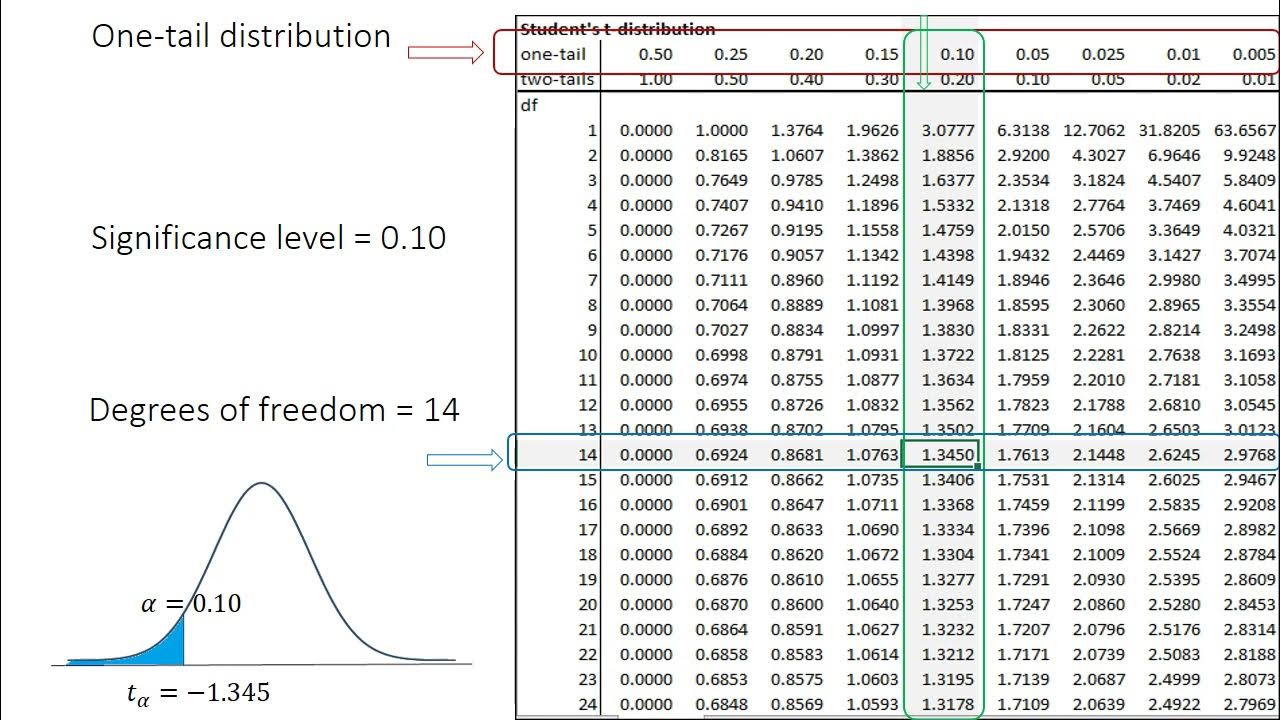
Once you have the T-statistic, you can then compare it to critical values from the T-distribution to determine the significance of the result. The critical values are determined based on the desired level of significance (usually denoted by alpha) and degrees of freedom (which is based on the sample size).
If the T-statistic falls within the acceptance region (between the critical values), then we fail to reject the null hypothesis. This means that there is not enough evidence to suggest that the sample mean is significantly different from the hypothesized population mean.
On the other hand, if the T-statistic falls outside the acceptance region (beyond the critical values), then we reject the null hypothesis. This suggests that there is enough evidence to suggest that the sample mean is significantly different from the hypothesized population mean.
In summary, the T-statistic is calculated using the difference between the sample mean and the hypothesized population mean, divided by the standard error of the sample mean. The T-distribution is then used to determine the significance of the T-statistic by comparing it to critical values.
Topics related to T-distribution
Student's T Distribution – YouTube

Student's T Distribution – YouTube
Introduction to the t Distribution (non-technical) – YouTube

Introduction to the t Distribution (non-technical) – YouTube
Student's T Distribution – Confidence Intervals & Margin of Error – YouTube

Student's T Distribution – Confidence Intervals & Margin of Error – YouTube
An Introduction to the t Distribution (Includes some mathematical details) – YouTube

An Introduction to the t Distribution (Includes some mathematical details) – YouTube
What is the t-distribution? An extensive guide! – YouTube

What is the t-distribution? An extensive guide! – YouTube
t critical value Using the t-distribution table – YouTube
t critical value Using the t-distribution table – YouTube
Bitcoin: Digital Gold? | Free Documentary – YouTube

Bitcoin: Digital Gold? | Free Documentary – YouTube
The World as a Neural Network. Group meeting #16: Science, Philosophy and Religion – YouTube

The World as a Neural Network. Group meeting #16: Science, Philosophy and Religion – YouTube
The most important ideas in modern statistics – YouTube

The most important ideas in modern statistics – YouTube
Sampling Distributions (7.2) – YouTube

Sampling Distributions (7.2) – YouTube

Peter Scholze is a distinguished German mathematician born on December 11, 1987. Widely recognized for his profound contributions to arithmetic algebraic geometry, Scholze gained international acclaim for his work on perfectoid spaces. This innovative work has significantly impacted the field of mathematics, particularly in the study of arithmetic geometry. He is a leading figure in the mathematical community.