Introduction to Standard Error
Standard error is a statistical term that quantifies the variability or uncertainty of a sample statistic, such as the mean or proportion, to estimate the true population parameter. It measures how much the sample statistic is likely to vary from the true population parameter in repeated sampling.
The standard error is calculated by taking the standard deviation of the sample statistic and dividing it by the square root of the sample size. It gives an indication of the precision or reliability of the sample statistic as an estimate of the population parameter.
The concept of standard error is particularly useful when making inferences or drawing conclusions about a population based on a sample. It allows researchers to assess the uncertainty associated with the sample statistic and to make statements about the likelihood of the population parameter falling within a certain range.
For example, if you are interested in estimating the average height of all adults in a country, you might take a sample of individuals and calculate the sample mean. The standard error would then tell you how much the sample mean is likely to vary from the true population mean. A smaller standard error indicates a more precise estimate, while a larger standard error indicates a less precise estimate.
In summary, the standard error provides a measure of the variability or uncertainty associated with a sample statistic. It helps researchers to assess the reliability of their estimates and make informed inferences about the population of interest.
Calculation of Standard Error
The standard error is a measure of the precision with which sample statistics (such as the mean or regression coefficients) estimate population parameters. It quantifies the variability of sample statistics across multiple samples drawn from the same population.
The calculation of the standard error depends on the specific statistic being estimated. Here are some common formulas for calculating the standard error for different statistics:
1. Standard Error of the Mean (SEM):
– If you have the individual data values, the formula is: SEM = standard deviation / sqrt(n), where n is the sample size.
– If you only have summary statistics (mean and standard deviation), the formula is: SEM = standard deviation / sqrt(n).
2. Standard Error of the Proportion:
– The formula is: SE(p) = sqrt(p * (1 – p) / n), where p is the sample proportion and n is the sample size.
3. Standard Error of the Difference between Means:
– The formula is: SEM_diff = sqrt((s1^2 /n1) + (s2^2 /n2)), where s1 and s2 are the standard deviations of the two samples, and n1 and n2 are the sample sizes.
4. Standard Error of the Coefficient in Regression:
– The formula depends on the specific regression model being used. In simple linear regression, it is: SE(beta) = sqrt(MSE / (n * (x – mean(x))^2)), where MSE is the mean squared error, n is the sample size, and x is the sample mean of the independent variable.
These are just a few examples, and there are many other statistics for which the standard error can be calculated. Always refer to the appropriate formula for the statistic you are working with.
Interpretation of Standard Error
The standard error is a statistical term that measures the variability or uncertainty associated with a sample statistic. It represents the average amount that a sample statistic, such as a mean or proportion, is likely to differ from the population parameter it estimates.
In other words, the standard error provides an estimate of the accuracy of the sample statistic. It tells us how much we can expect the sample mean or proportion to vary from one sample to another due to random sampling variability.
A smaller standard error indicates a more precise estimate, meaning that the sample statistic is likely to be closer to the population parameter. Conversely, a larger standard error suggests greater uncertainty and less precision in the estimate.
The standard error is often used to calculate confidence intervals, which provide a range of values within which the true population parameter is likely to lie. It is also used in hypothesis testing to determine whether a sample statistic is significantly different from a hypothesized value.
Overall, the standard error is a useful measure that helps to quantify the reliability and precision of sample statistics in statistical inference.
Importance of Standard Error in Statistics
The standard error is a measure of the variability or precision of estimate in statistics. It quantifies the level of uncertainty associated with a particular statistic, such as the mean or regression coefficient, and provides a sense of how much the estimate may vary from the true population value.
The importance of the standard error lies in its ability to provide a measure of the sampling variability. When conducting statistical analysis, researchers aim to estimate population parameters using data from a sample. However, due to the randomness involved in the sampling process, different samples would often yield different estimates. The standard error helps to capture this variability and allows researchers to assess the reliability of their estimates.
By comparing the standard errors of different estimates, researchers can evaluate the precision of their findings. Smaller standard errors indicate more precise estimates, meaning the estimate is more likely to be close to the true population value. On the other hand, larger standard errors suggest that the estimate may be less reliable and more likely to deviate further from the population value.
Moreover, standard errors are crucial in hypothesis testing and construction of confidence intervals. In hypothesis testing, the standard error is used to compute the test statistic, which determines the likelihood of observing the estimated value under the null hypothesis. It helps assess whether the observed difference between groups or the estimated coefficient is statistically significant.
Confidence intervals, on the other hand, provide a range of plausible values for the population parameter. The standard error is used to construct these intervals, which indicate the level of uncertainty surrounding the estimate. Wider intervals, corresponding to larger standard errors, imply higher uncertainty, while narrower intervals indicate greater precision.
In summary, the standard error plays a fundamental role in statistics as it provides a measure of the precision, uncertainty, and reliability of estimates. It helps researchers assess the sampling variability, make comparisons, conduct hypothesis tests, and construct confidence intervals, contributing to more robust and accurate statistical analysis.
Applications of Standard Error in Mathematics
The standard error plays a crucial role in various applications in mathematics. Here are a few examples:
1. Estimation of population parameters: In statistics, when we have a sample and aim to make inferences about the population parameters, we often use the standard error. For instance, the standard error of the mean (SEM) is used to estimate the uncertainty associated with the sample mean as an estimate of the population mean. It provides a measure of how much the sample mean is expected to deviate from the true population mean.
2. Hypothesis testing: Standard error is commonly used in hypothesis testing to determine the significance of results. For example, in regression analysis, the standard error of the coefficients is computed to assess the reliability of the estimated coefficients. It helps determine whether the coefficients are statistically different from zero.
3. Confidence intervals: Standard error is used to construct confidence intervals, which provide an estimated range of values that likely contains the true population parameter with a certain level of confidence. For example, the standard error is used in calculating the margin of error when constructing confidence intervals for the population mean or proportion.
4. Tolerance intervals: Standard error is also involved in computing tolerance intervals, which provide a range of values that captures a specified proportion of the population with a certain level of confidence. The standard error is used to account for the variation within the population and establish the interval width.
Overall, the standard error is a crucial mathematical tool used in estimation, hypothesis testing, and constructing intervals to make inferences about population parameters based on sample data.
Topics related to Standard error
How To Calculate The Standard Deviation – YouTube
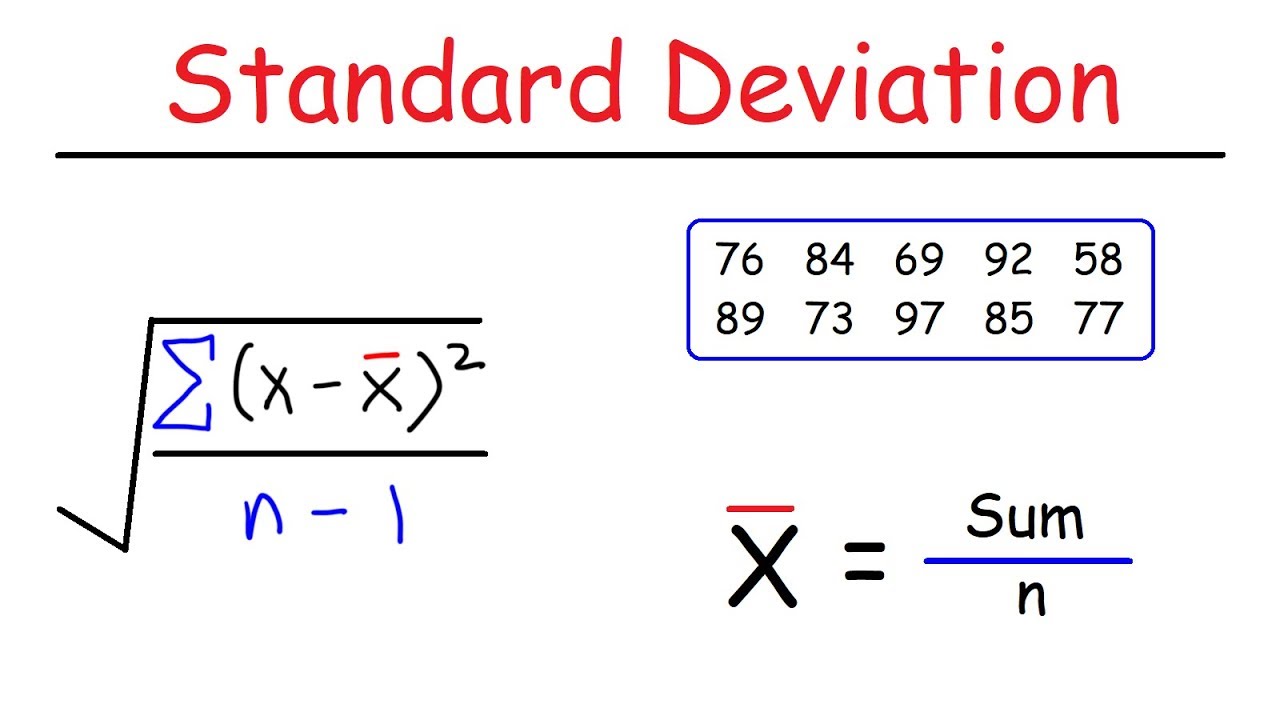
How To Calculate The Standard Deviation – YouTube
Standard Deviation Formula, Statistics, Variance, Sample and Population Mean – YouTube
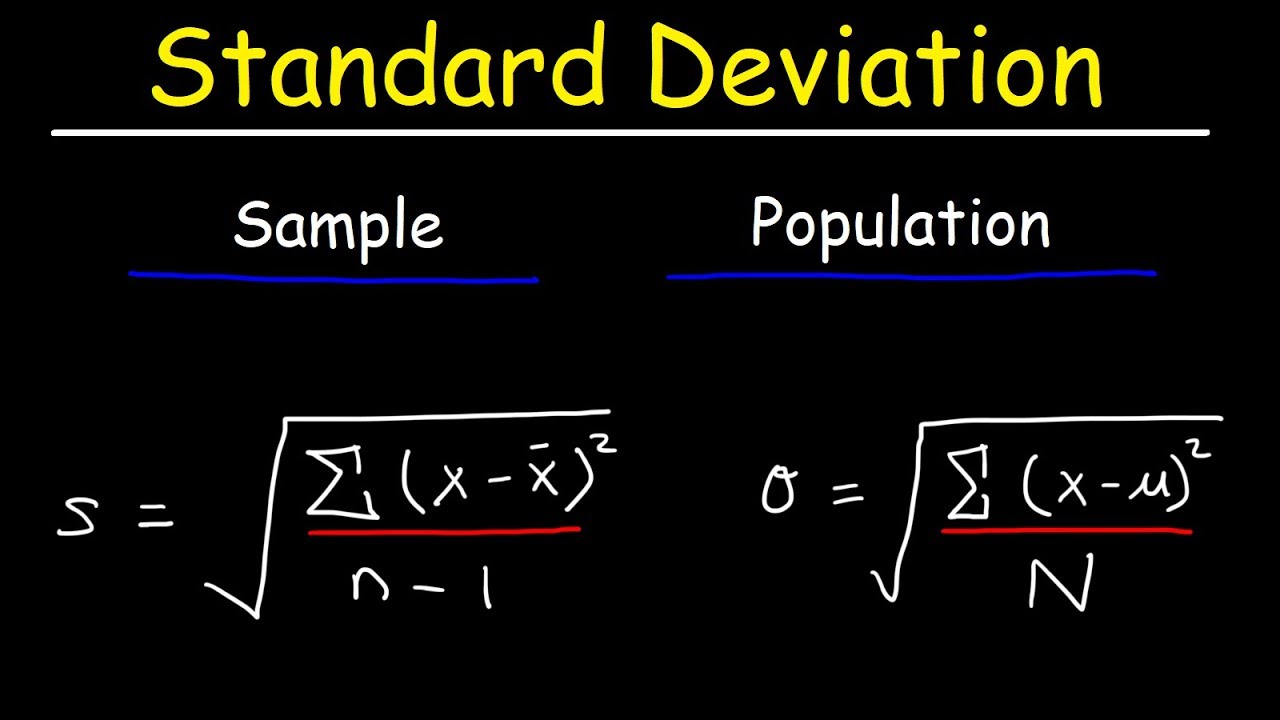
Standard Deviation Formula, Statistics, Variance, Sample and Population Mean – YouTube
Standard Error – YouTube

Standard Error – YouTube
The Standard Deviation (and Variance) Explained in One Minute: From Concept to Definition & Formulas – YouTube

The Standard Deviation (and Variance) Explained in One Minute: From Concept to Definition & Formulas – YouTube
Mean deviation, variance and standard deviation of grouped data. – YouTube

Mean deviation, variance and standard deviation of grouped data. – YouTube
[December SAT Math] Standard Deviation – ONE Simple Key To ALL The Questions | Everything You Need – YouTube

[December SAT Math] Standard Deviation – ONE Simple Key To ALL The Questions | Everything You Need – YouTube
Standard Deviation vs Standard Error, Clearly Explained!!! – YouTube
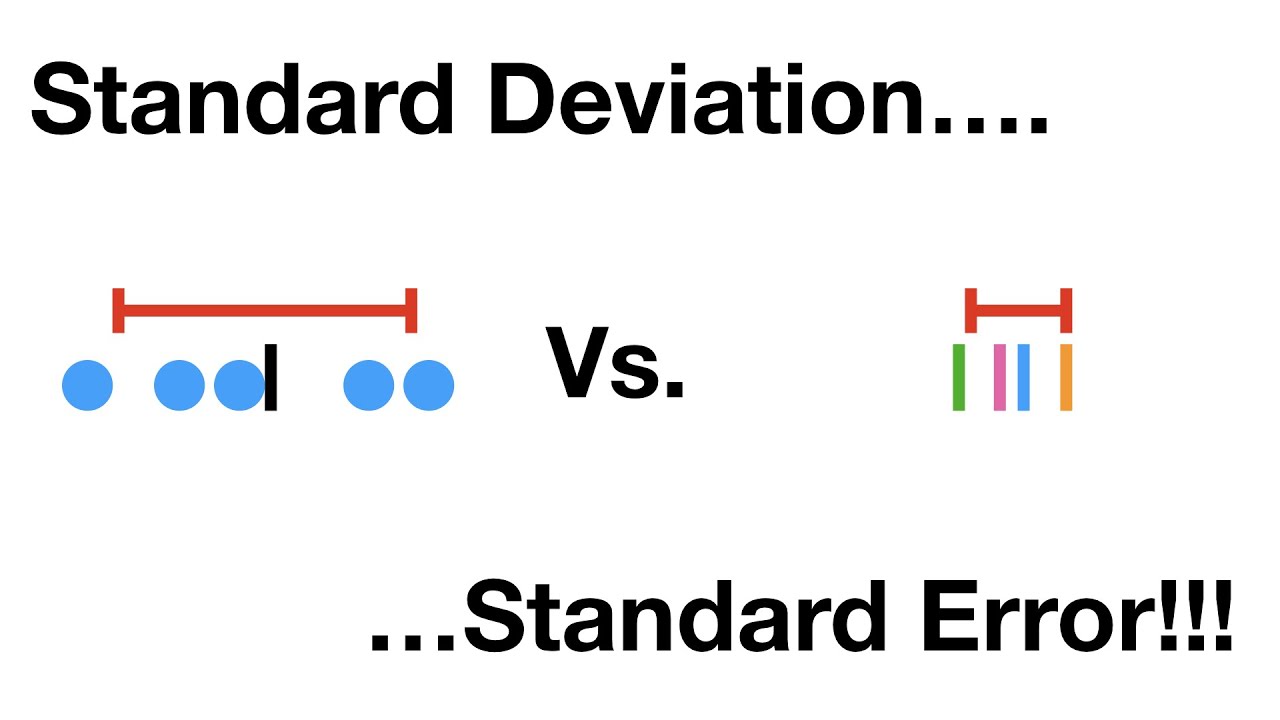
Standard Deviation vs Standard Error, Clearly Explained!!! – YouTube
How to calculate Standard Deviation and Variance – YouTube
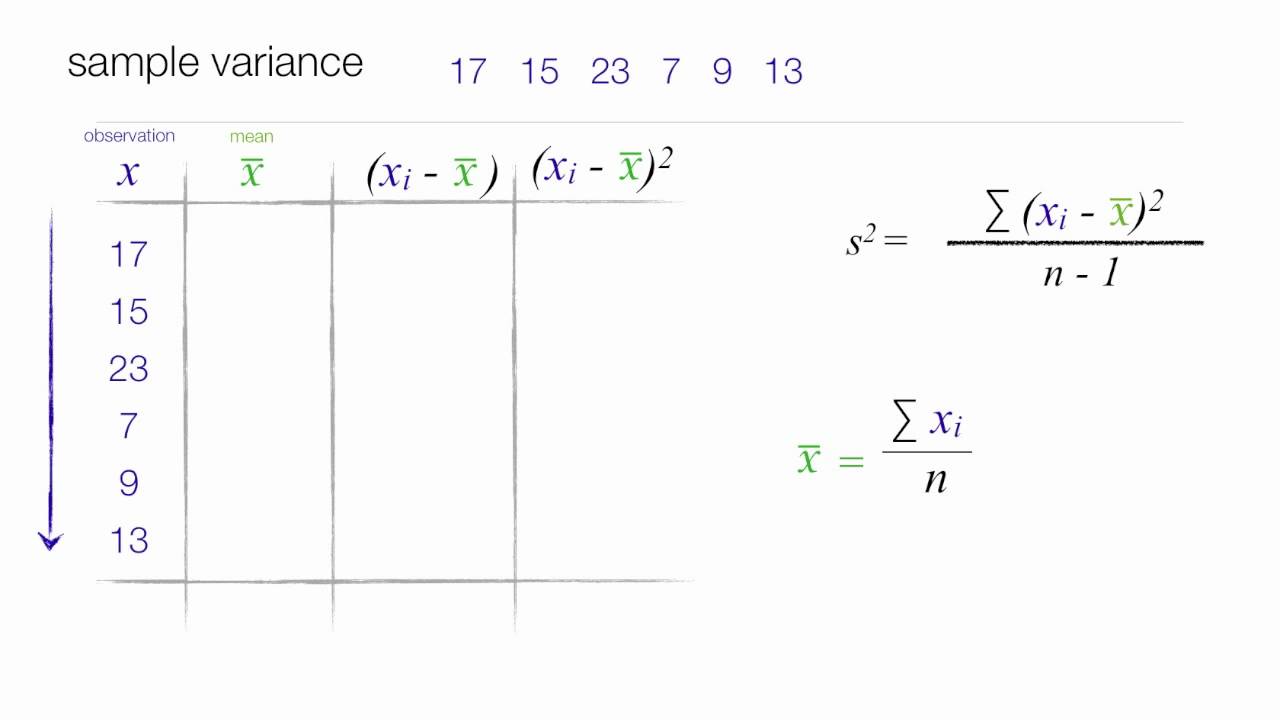
How to calculate Standard Deviation and Variance – YouTube
But what is the Central Limit Theorem? – YouTube

But what is the Central Limit Theorem? – YouTube
Human Calculator Solves World’s Longest Math Problem #shorts – YouTube

Human Calculator Solves World’s Longest Math Problem #shorts – YouTube

Peter Scholze is a distinguished German mathematician born on December 11, 1987. Widely recognized for his profound contributions to arithmetic algebraic geometry, Scholze gained international acclaim for his work on perfectoid spaces. This innovative work has significantly impacted the field of mathematics, particularly in the study of arithmetic geometry. He is a leading figure in the mathematical community.