Definition of correlation coefficient
The correlation coefficient is a statistical measure that indicates the strength and direction of the linear relationship between two variables. It is denoted by the symbol “r” and ranges from -1 to +1.
The correlation coefficient quantifies the extent to which the values of one variable increase or decrease as the values of the other variable change. A positive correlation coefficient (ranging from 0 to +1) indicates a positive linear relationship, meaning that as one variable increases, the other variable also tends to increase. Conversely, a negative correlation coefficient (ranging from 0 to -1) indicates a negative linear relationship, meaning that as one variable increases, the other variable tends to decrease.
A correlation coefficient of 0 suggests no linear relationship between the variables and means that changes in one variable do not affect the other variable. The closer the correlation coefficient is to +1 or -1, the stronger the linear relationship between the variables. A correlation coefficient of +1 or -1 represents a perfect positive or negative linear relationship, respectively, where all data points fall exactly on a straight line.
Overall, the correlation coefficient provides important information about the relationship between two variables, allowing researchers to understand and analyze the connection between them in a quantitative manner.
Calculation of correlation coefficient
The correlation coefficient is a numerical value that measures the strength and direction of the linear relationship between two variables. It ranges from -1 to +1, where -1 indicates a perfect negative correlation, +1 indicates a perfect positive correlation, and 0 indicates no correlation.
To calculate the correlation coefficient, you need to have a set of paired data points for the two variables. Let’s call the two variables X and Y, and assume we have n data points.
1. Calculate the mean of X and Y. Let’s call them X̄ and Ȳ, respectively.
2. Calculate the difference between each X value and X̄, and each Y value and Ȳ.
3. Multiply each difference in X by its corresponding difference in Y.
4. Square each difference in X and each difference in Y.
5. Sum up the squared differences in X, the squared differences in Y, and the products of differences in X and Y separately.
6. Calculate the square root of the sums of the squared differences in X and Y: sqrt(sum(X-X̄)^2) and sqrt(sum(Y-Ȳ)^2).
7. Divide the sum of the products of differences in X and Y by the product of the square roots of sums of squared differences in X and Y: sum((X-X̄)*(Y-Ȳ))/sqrt(sum(X-X̄)^2)*sqrt(sum(Y-Ȳ)^2)).
This will give you the correlation coefficient, denoted by r.
It’s important to note that the calculation assumes the relationship between X and Y is linear. If the relationship is non-linear, the correlation coefficient may not accurately represent the strength and direction of the relationship.
Interpretation of correlation coefficient
The correlation coefficient is a statistical measure that quantifies the strength and direction of the relationship between two variables. It ranges from -1 to +1, where +1 represents a strong positive correlation, -1 represents a strong negative correlation, and 0 represents no correlation.
If the correlation coefficient is close to +1, it indicates a strong positive relationship, meaning that as one variable increases, the other variable also tends to increase. For example, there may be a high positive correlation between the hours of study and the grades obtained by students, suggesting that students who study more tend to achieve higher grades.
On the other hand, if the correlation coefficient is close to -1, it indicates a strong negative relationship, meaning that as one variable increases, the other variable tends to decrease. For instance, there might be a high negative correlation between the number of cigarettes smoked and lung capacity, indicating that as the number of cigarettes smoked increases, lung capacity decreases.
When the correlation coefficient is close to 0, it suggests no linear relationship between the variables. This means that changes in one variable do not consistently correspond to changes in the other variable.
It is important to note that correlation does not imply causation. While a strong correlation can indicate an association between two variables, it does not prove that one variable directly causes the other to change. Other factors not accounted for in the analysis may be influencing the relationship.
Strength and direction of correlation
The strength of a correlation refers to how well the data points fit along a consistent trend line. A strong correlation means that the data points are closely clustered around the trend line, while a weak correlation means that the points are more spread out.
The direction of a correlation refers to the relationship between the two variables being studied. A positive correlation means that as one variable increases, the other variable also tends to increase. In other words, they move in the same direction. A negative correlation means that as one variable increases, the other variable tends to decrease. In other words, they move in opposite directions.
The correlation coefficient is a statistic that measures both the strength and direction of the relationship between two variables. It ranges from -1 to +1. A correlation coefficient of +1 indicates a perfect positive correlation, -1 indicates a perfect negative correlation, and 0 indicates no correlation. The closer the correlation coefficient is to either -1 or +1, the stronger the relationship, and the closer it is to 0, the weaker the relationship.
Uses and significance of correlation coefficient
The correlation coefficient is a statistical measure that determines the strength and direction of the relationship between two variables. It is denoted by the symbol “r” and ranges from -1 to +1.
The main uses and significance of the correlation coefficient are as follows:
1. Relationship assessment: The correlation coefficient helps to quantify how closely two variables are related to each other. A value close to +1 indicates a strong positive relationship, where both variables increase or decrease together. A value close to -1 indicates a strong negative relationship, where one variable increases as the other decreases. A value close to 0 indicates little to no relationship between the variables.
2. Prediction: The correlation coefficient can be used to make predictions. If two variables have a strong positive correlation, knowing the value of one variable allows us to make a reasonably accurate prediction about the value of the other variable.
3. Variable selection: When analyzing the relationship between multiple variables, the correlation coefficient can help in identifying which variables are strongly related to each other. This helps in selecting the most relevant variables for further analysis or prediction modeling.
4. Testing hypotheses: The correlation coefficient is used to test hypotheses about the relationship between variables. It helps in determining whether the observed relationship is statistically significant or occurred by chance.
5. Quality control: In quality control processes, the correlation coefficient is used to assess the relationship between variables such as product quality and production parameters. It helps in identifying factors that significantly impact product quality and allows for necessary adjustments to be made.
6. Portfolio diversification: In finance and investment management, the correlation coefficient is useful in assessing the relationship between different assets in a portfolio. A portfolio with assets that have low or negative correlations can help in reducing overall risk and increasing diversification.
Overall, the correlation coefficient plays a significant role in understanding and quantifying the relationship between variables in various fields, aiding in decision-making, research, and analyses.
Topics related to Correlation coefficient
Example: Correlation coefficient intuition | Mathematics I | High School Math | Khan Academy – YouTube
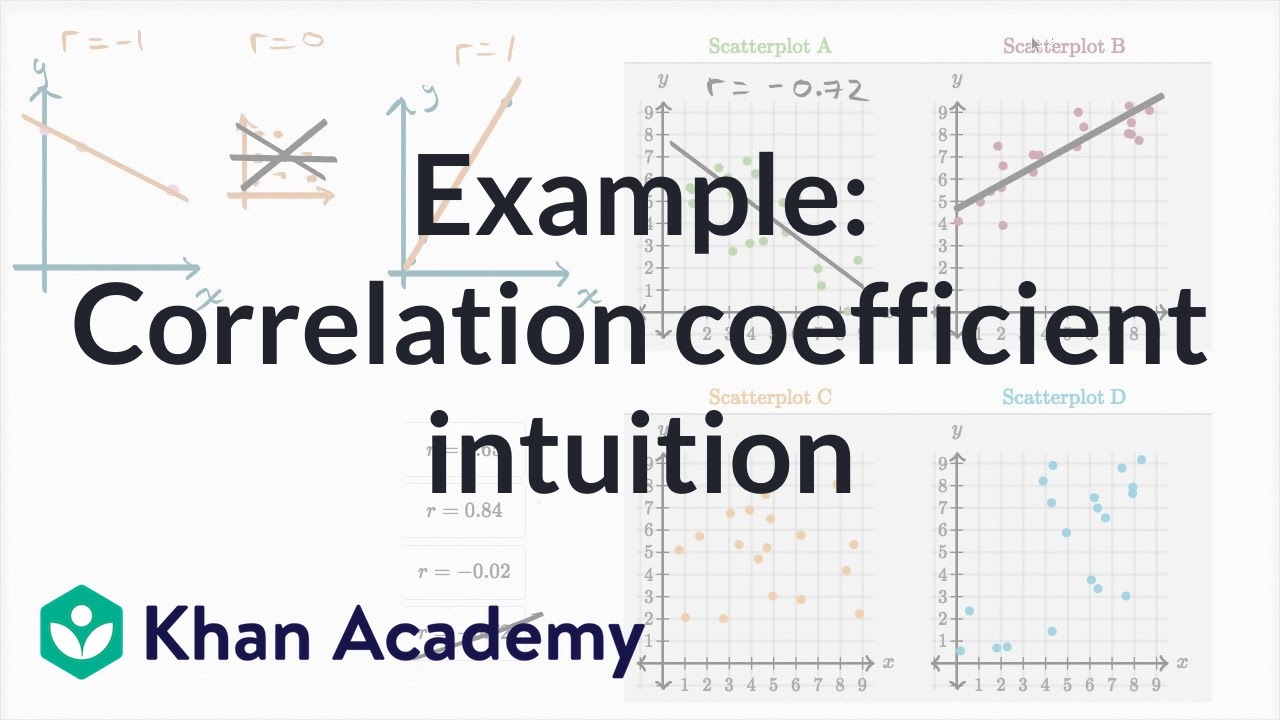
Example: Correlation coefficient intuition | Mathematics I | High School Math | Khan Academy – YouTube
Correlation Coefficient – YouTube
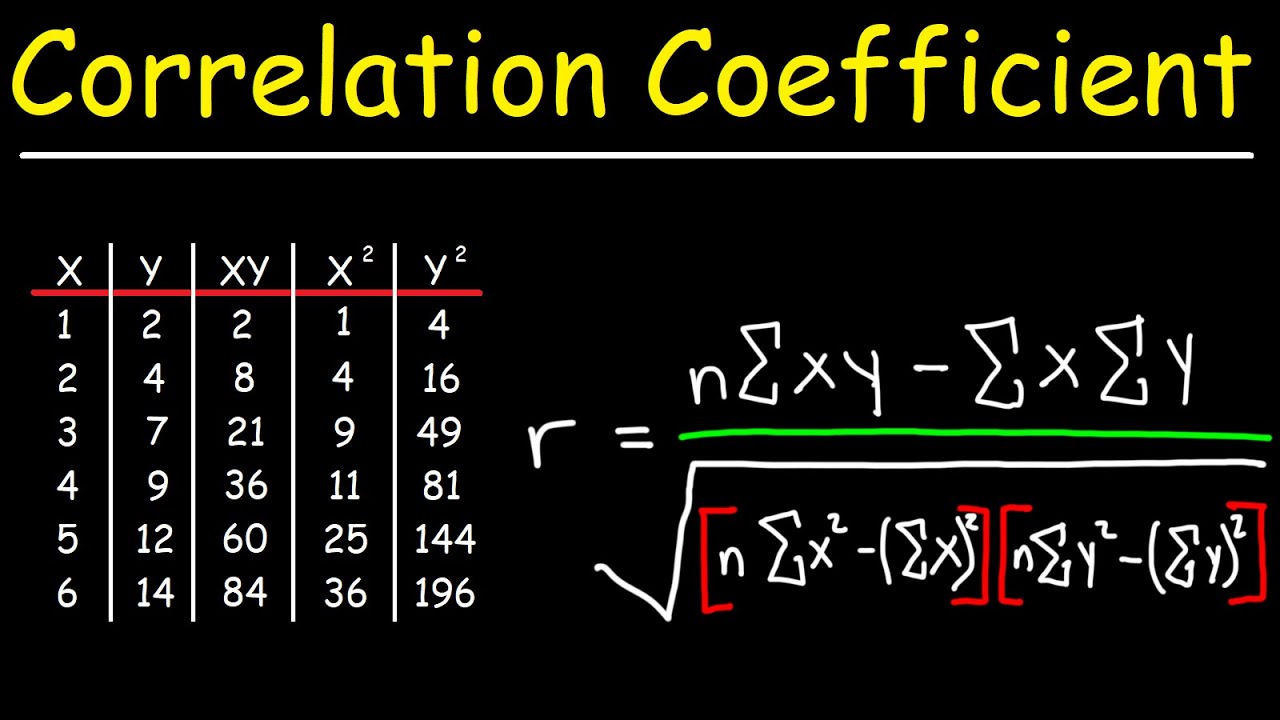
Correlation Coefficient – YouTube
Incentive Ad Desktop – YouTube

Incentive Ad Desktop – YouTube
Correlation Coefficient | Correlation Coefficient Example | Statistics – YouTube

Correlation Coefficient | Correlation Coefficient Example | Statistics – YouTube
Rank Correlation | Rank Correlation Coefficient | Spearman Rank Correlation – YouTube

Rank Correlation | Rank Correlation Coefficient | Spearman Rank Correlation – YouTube
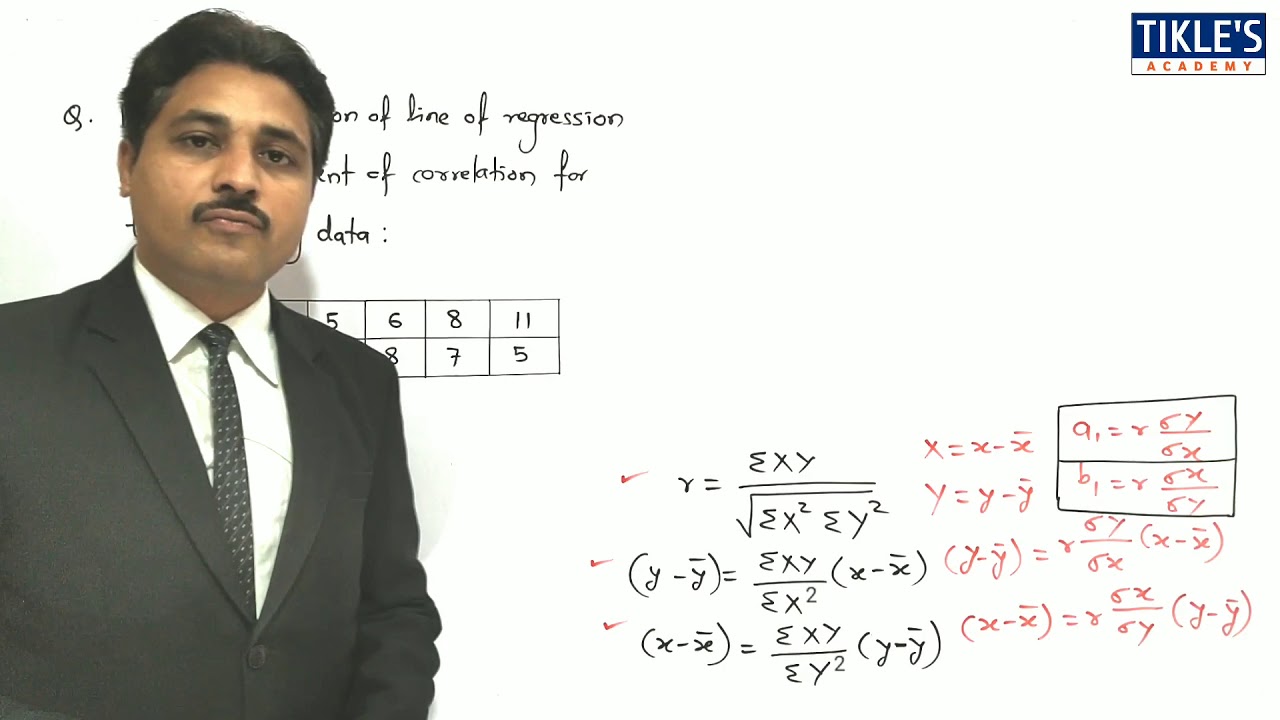
COEFFICIENT OF CORRELATION AND REGRESSION LINE SOLVED PROBLEM 1 IN STATISTICS @TIKLESACADEMY – YouTube

COEFFICIENT OF CORRELATION AND REGRESSION LINE SOLVED PROBLEM 1 IN STATISTICS @TIKLESACADEMY – YouTube
COEFFICIENT OF CORRELATION AND REGRESSION LINE SOLVED PROBLEM 2 IN STATISTICS – YouTube
COEFFICIENT OF CORRELATION AND REGRESSION LINE SOLVED PROBLEM 2 IN STATISTICS – YouTube
Pearson's Correlation Coefficient (1 of 3: Unpacking the formula) – YouTube

Pearson's Correlation Coefficient (1 of 3: Unpacking the formula) – YouTube
How to Calculate Pearson's Correlation Coefficient – YouTube

How to Calculate Pearson's Correlation Coefficient – YouTube
Karl Pearson's Coefficient of Correlation with direct method #correlation #biostatistics – YouTube

Karl Pearson's Coefficient of Correlation with direct method #correlation #biostatistics – YouTube

Peter Scholze is a distinguished German mathematician born on December 11, 1987. Widely recognized for his profound contributions to arithmetic algebraic geometry, Scholze gained international acclaim for his work on perfectoid spaces. This innovative work has significantly impacted the field of mathematics, particularly in the study of arithmetic geometry. He is a leading figure in the mathematical community.