Definition of a random variable
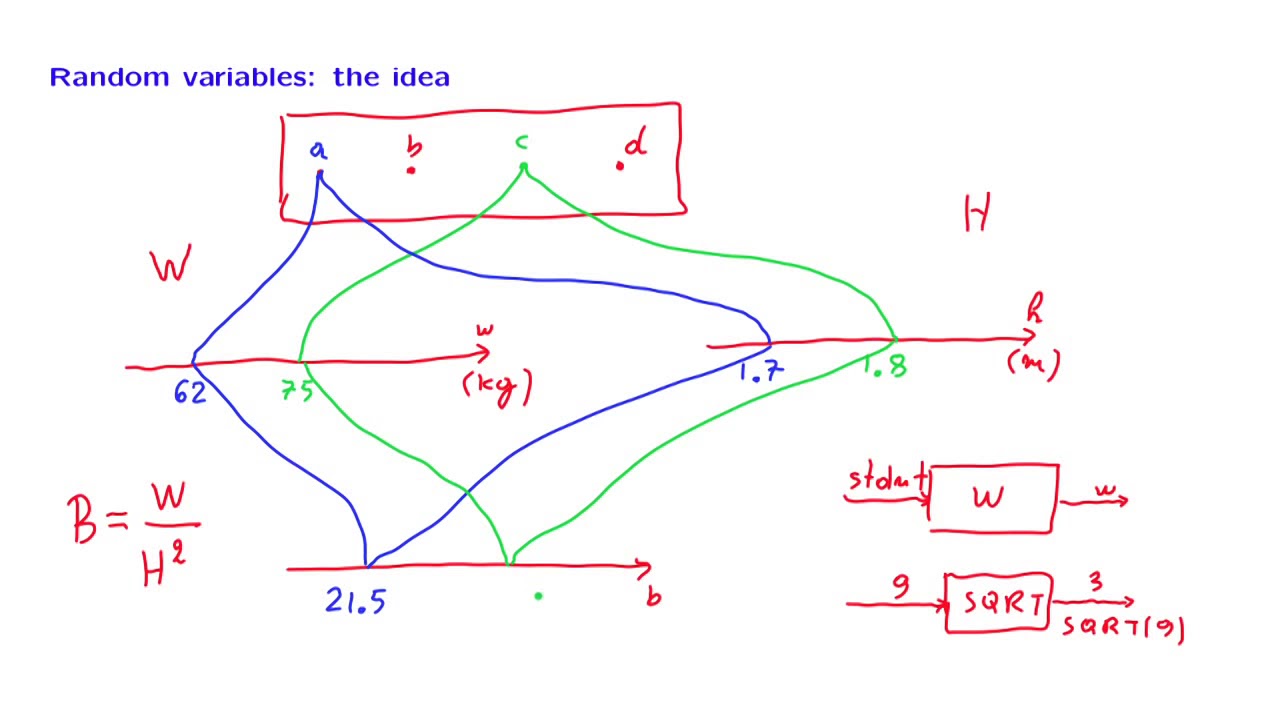
A random variable is a variable in statistics that takes on different values based on some probability distribution. It is used to represent and quantify uncertain outcomes in a random experiment or event. Random variables can be discrete, taking on specific values, or continuous, taking on any value within a certain range. They are often denoted by capital letters, such as X or Y, and can be used to calculate probabilities, expected values, and other statistical properties.
Types of random variables
Random variables can be classified into two main types: discrete random variables and continuous random variables.
1. Discrete Random Variable: A discrete random variable is one that can take on only a countable number of distinct values. It typically arises from counting processes or situations where there are finite or countably infinite outcomes. Examples of discrete random variables include the number of children in a family, the number of heads obtained when flipping a coin multiple times, or the number of defects in a batch of products.
2. Continuous Random Variable: A continuous random variable is one that can take on any value within a certain interval or range. It typically arises from measurement processes or situations where there is a continuum of possible outcomes. Examples of continuous random variables include the height of an individual, the time taken to complete a task, or the temperature at a specific time.
Random variables can be further categorized based on their probability distributions:
1. Bernoulli Random Variable: A Bernoulli random variable can take only two possible values, usually labeled as 0 and 1. It represents the outcome of a single Bernoulli trial, which has two possible outcomes with a fixed probability of success.
2. Binomial Random Variable: A binomial random variable represents the number of successes in a fixed number of independent Bernoulli trials. It has a specific probability distribution known as the binomial distribution.
3. Poisson Random Variable: A Poisson random variable represents the number of events that occur in a fixed interval of time or space. It is used to model situations with rare, random events occurring independently at a constant rate.
4. Normal Random Variable: A normal random variable follows a bell-shaped distribution known as the normal distribution or Gaussian distribution. It is commonly used to model continuous variables in many natural and social sciences.
5. Uniform Random Variable: A uniform random variable has a constant probability density function over a specified interval. It represents situations where all values within the interval are equally likely to occur.
These are just a few examples of the various types of random variables that are commonly encountered in probability theory and statistics.
Probability distribution of random variables
A probability distribution of a random variable is a function that assigns probabilities to different possible outcomes of the variable. It provides information on the likelihood of each outcome occurring.
A random variable is a numerical value that is determined by chance. It can take on different values in a given probability distribution. For example, in the case of rolling a fair six-sided die, the random variable could be the number that appears on the top face.
The probability distribution of a random variable can be represented in different ways. One common representation is a probability mass function (PMF) for discrete random variables or a probability density function (PDF) for continuous random variables. The PMF or PDF provides the probabilities of each possible outcome of the variable.
The properties of a probability distribution depend on whether the random variable is discrete or continuous. For discrete random variables, the probabilities assigned to each outcome must sum up to 1. For continuous random variables, the area under the PDF curve must be equal to 1.
Probability distributions are used to analyze and interpret data in various fields, including statistics, probability theory, and decision-making. They help in understanding the likelihood of different outcomes and making informed decisions based on that information.
Expected value and variance of random variables
Expected value and variance are important measures of a random variable.
The expected value of a random variable is the average value that the variable is expected to take, weighted by the probabilities of each outcome. It is denoted by E(X) or μ and is calculated by summing the products of each possible outcome with its corresponding probability.
For example, if X is a random variable representing the outcome of rolling a fair six-sided die, where each outcome has an equal probability of 1/6, the expected value would be:
E(X) = (1)(1/6) + (2)(1/6) + (3)(1/6) + (4)(1/6) + (5)(1/6) + (6)(1/6) = 3.5
The variance of a random variable measures the spread or dispersion of possible outcomes around the expected value. It is denoted by Var(X) or σ^2 and is calculated by taking the average of the squared differences between each outcome and the expected value, weighted by their probabilities.
Using the same example of rolling a fair six-sided die, the variance would be:
Var(X) = [(1-3.5)^2(1/6) + (2-3.5)^2(1/6) + (3-3.5)^2(1/6) + (4-3.5)^2(1/6) + (5-3.5)^2(1/6) + (6-3.5)^2(1/6)]
= 2.92
Both the expected value and variance provide valuable information about the behavior of a random variable, helping us understand the central tendency and spread of possible outcomes.
Applications of random variables in mathematics and statistics
Random variables are a fundamental concept in mathematics and statistics. They play a critical role in various applications within these fields. Here are some examples:
Probability theory: Random variables are used to model uncertain or random events mathematically. They provide a way to quantify and analyze the likelihood of different outcomes in probability theory. For instance, in the study of games of chance or gambling, random variables are often used to represent payoffs or winnings.
Statistical analysis: In statistics, random variables are used to represent observable quantities that vary due to randomness or chance. They are the building blocks of statistical models, which are used to describe and understand the variation in data. Random variables help describe the probability distributions that data points are assumed to follow.
Hypothesis testing: Random variables play a crucial role in hypothesis testing, which is a statistical procedure used to make inferences about a population based on sample data. The null and alternative hypotheses are formulated in terms of random variables, and statistical tests are performed to assess the evidence for or against the null hypothesis.
Estimation and confidence intervals: Random variables are involved in the estimation of unknown parameters from sample data. Techniques like maximum likelihood estimation rely on random variables to represent the observed data and model the underlying probability distribution. Confidence intervals, which provide an interval estimation of the true parameter value, also utilize random variables.
Simulation and Monte Carlo methods: Random variables are extensively used in computer simulations and Monte Carlo methods. Simulating random variables with known probability distributions allows researchers to model complex systems and perform numerical experiments. Monte Carlo methods use random variables to perform numerical integration, solve optimization problems, or estimate statistical quantities.
Stochastic processes: Random variables are a central concept in the study of stochastic processes, which are mathematical models that capture the evolution of random phenomena over time. Examples include Brownian motion, Poisson processes, and Markov chains. Random variables help define the probabilistic behavior of these processes and enable their analysis and prediction.
These applications illustrate the importance of random variables in mathematics and statistics. By providing a rigorous framework for modeling and analyzing uncertainty, they lay the foundation for many tools and techniques in these disciplines.
Topics related to Random variable
Random variables | Probability and Statistics | Khan Academy – YouTube

Random variables | Probability and Statistics | Khan Academy – YouTube
Statistics And Probability | Overview Of Random Variable & Probability Distribution – YouTube

Statistics And Probability | Overview Of Random Variable & Probability Distribution – YouTube
Random Variable, Probability Mass Function, Distribution Function – YouTube

Random Variable, Probability Mass Function, Distribution Function – YouTube
BlackFriday23_TT_Video_60s Trailer_Bow Black_Logo@H1-BF@SH1@TL1@BL1_16x9 C-Shape_YouTube_v1_v1 – YouTube

BlackFriday23_TT_Video_60s Trailer_Bow Black_Logo@H1-BF@SH1@TL1@BL1_16x9 C-Shape_YouTube_v1_v1 – YouTube
Random Variables (Continuous Random Variables and Discrete Random Variables), with Examples [HD] – YouTube

Random Variables (Continuous Random Variables and Discrete Random Variables), with Examples [HD] – YouTube
Cumulative Distribution Function (CDF) and Properties of CDF/ Random Variables and Sample Space – YouTube

Cumulative Distribution Function (CDF) and Properties of CDF/ Random Variables and Sample Space – YouTube
Random Variable/Probability Distribution/Mean and Variance Class 12th – Probability CBSE/ISC 2021 – YouTube

Random Variable/Probability Distribution/Mean and Variance Class 12th – Probability CBSE/ISC 2021 – YouTube
Math Made Easy by StudyPug! F3.0.0 – YouTube

Math Made Easy by StudyPug! F3.0.0 – YouTube
Discrete and continuous random variables | Probability and Statistics | Khan Academy – YouTube

Discrete and continuous random variables | Probability and Statistics | Khan Academy – YouTube
L05.2 Definition of Random Variables – YouTube
L05.2 Definition of Random Variables – YouTube

Peter Scholze is a distinguished German mathematician born on December 11, 1987. Widely recognized for his profound contributions to arithmetic algebraic geometry, Scholze gained international acclaim for his work on perfectoid spaces. This innovative work has significantly impacted the field of mathematics, particularly in the study of arithmetic geometry. He is a leading figure in the mathematical community.