Definition of standard deviation
Standard deviation is a statistical measurement that quantifies the amount of variation or dispersion in a set of values. It measures how spread out or apart the data points are from the mean (average) of the data set.
In other words, standard deviation provides information about the consistency and reliability of the data. A smaller standard deviation indicates that the data points are closer to the mean, while a larger standard deviation indicates that the data points are more spread out.
Standard deviation is commonly used in various fields, such as finance, economics, psychology, and natural sciences, to analyze and interpret data sets. It helps in understanding the extent to which data points deviate from the average, enabling researchers and analysts to make meaningful comparisons and draw conclusions.
Calculation of standard deviation
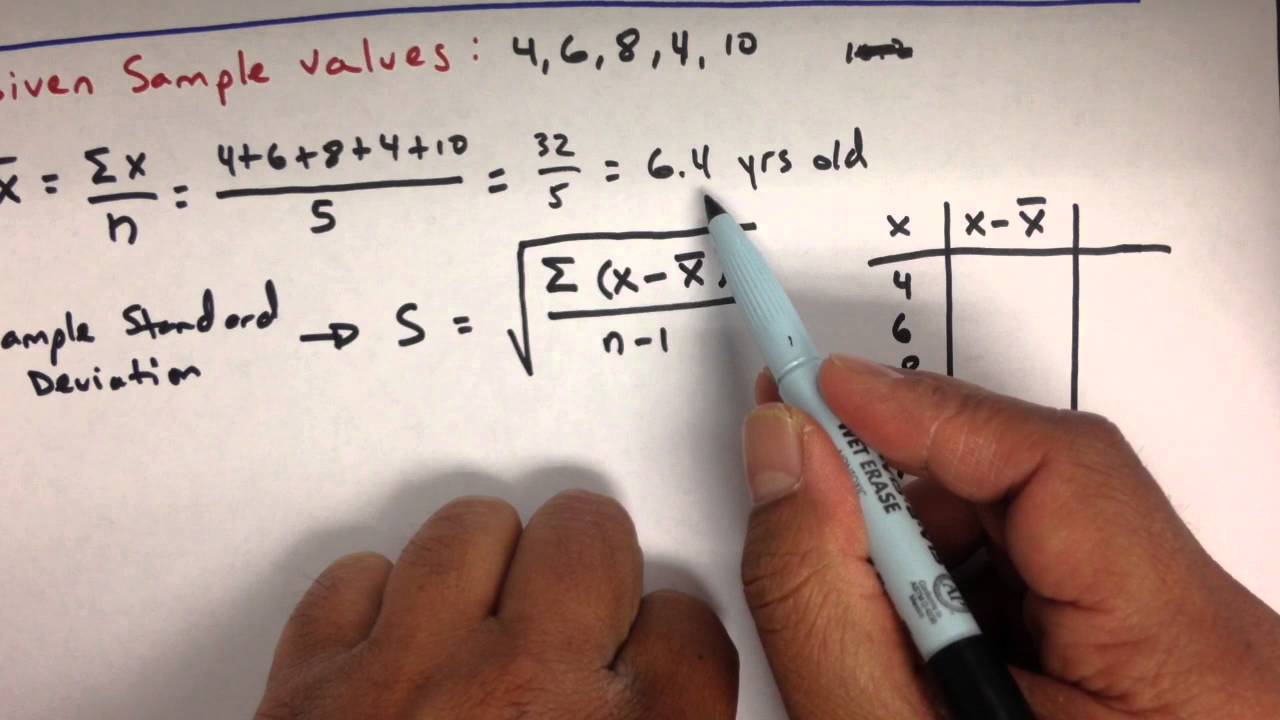
The calculation of standard deviation involves several steps. Here is the formula and the steps to calculate it:
1. Calculate the mean (average) of the data set.
2. Subtract the mean from each data point and square the result.
3. Calculate the mean of the squared differences.
4. Take the square root of the mean calculated in step 3.
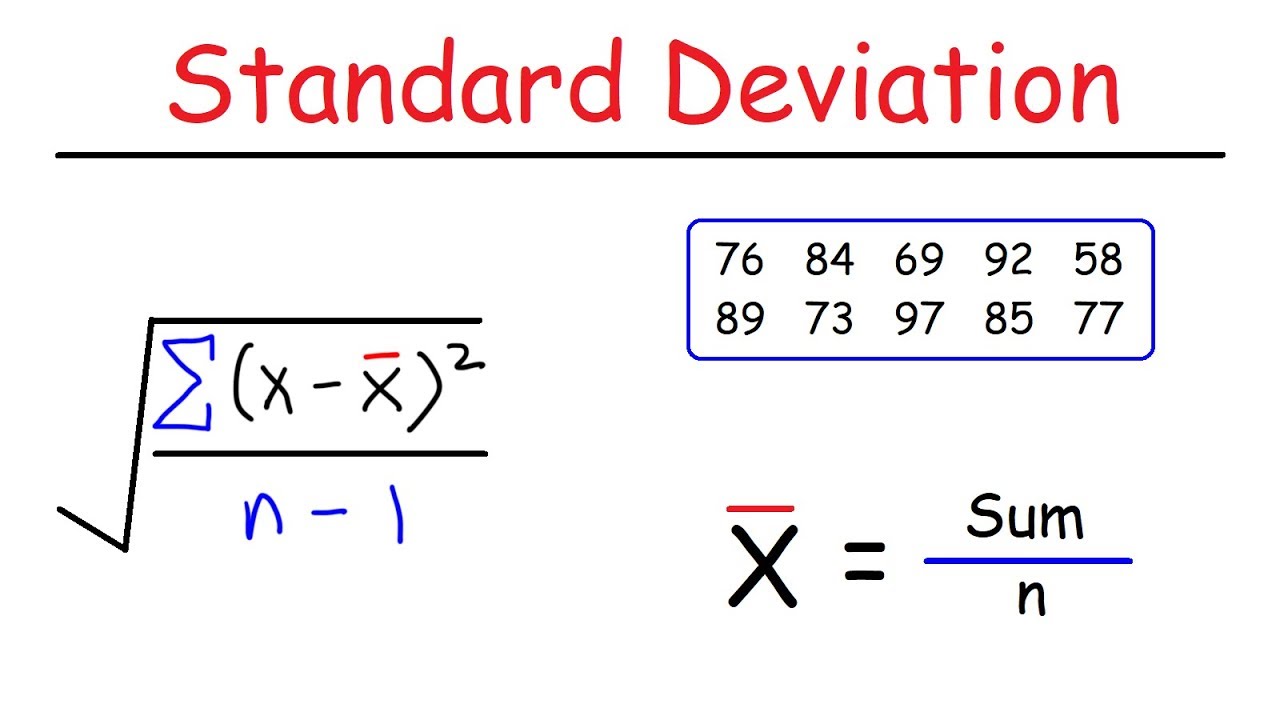
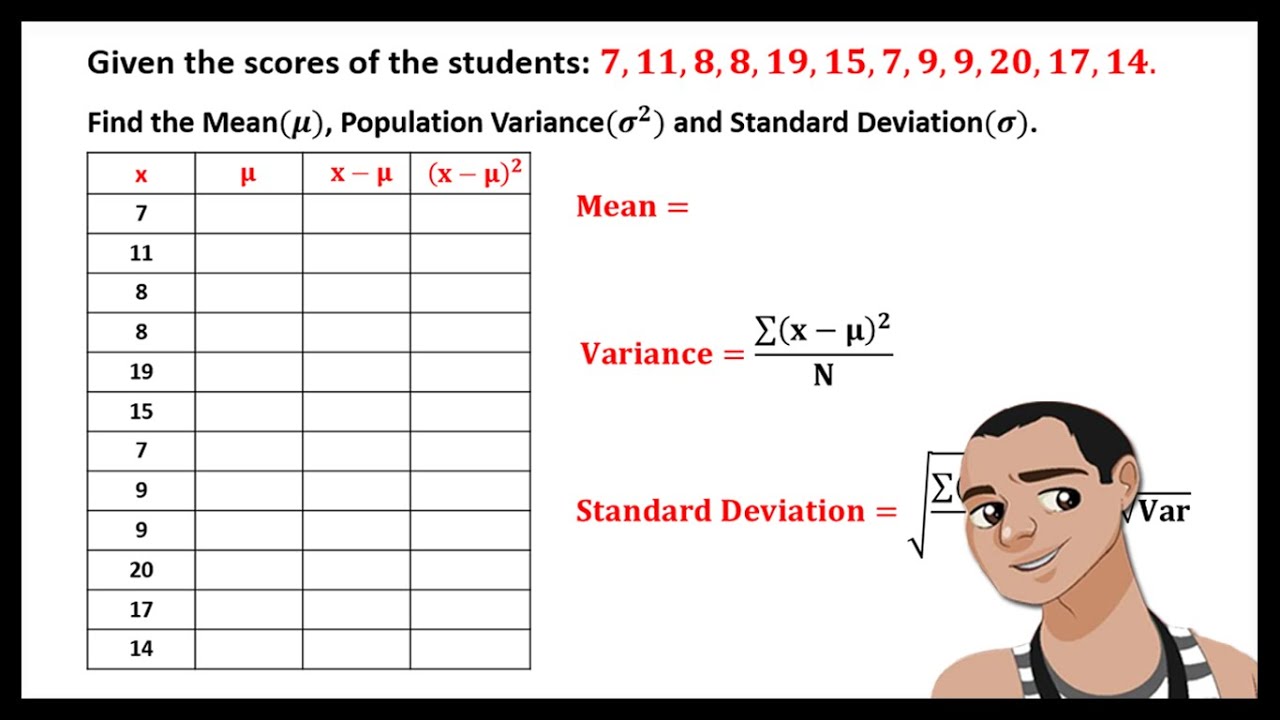
The formula for standard deviation is:
Standard Deviation = √( Σ(x – μ)^2 / N )
where:
– Σ is the sum of the squared differences
– x is each individual data point
– μ is the mean of the data set
– N is the total number of data points
Let’s go through an example calculation:
Example: Calculate the standard deviation for the following data set: 1, 2, 3, 4, 5
1. Calculate the mean: (1 + 2 + 3 + 4 + 5) / 5 = 3
2. Subtract the mean from each data point and square the result:
(1 – 3)^2 = 4
(2 – 3)^2 = 1
(3 – 3)^2 = 0
(4 – 3)^2 = 1
(5 – 3)^2 = 4
3. Calculate the mean of the squared differences: (4 + 1 + 0 + 1 + 4) / 5 = 2
4. Take the square root of the mean: √2 ≈ 1.41
Therefore, the standard deviation of the data set is approximately 1.41.
Interpretation of standard deviation
The standard deviation is a statistical measure that indicates the amount of variation or dispersion in a set of data. It provides a quantifiable measure of how spread out the values are from the mean (average) of the data.
A small standard deviation indicates that the values in the data set are close to the mean, while a large standard deviation indicates that the values are spread out from the mean. In other words, a low standard deviation suggests that the data points are relatively consistent and clustered closely around the mean, while a high standard deviation suggests that the data points are more varied and dispersed.
The standard deviation is commonly used in various fields to analyze data and make inferences. For example, in finance, it is used to measure the volatility of an investment, where a higher standard deviation indicates higher risk. In quality control, it is used to assess the consistency and reliability of manufacturing processes, with a smaller standard deviation indicating higher quality.
Overall, the standard deviation is a useful tool to understand the distribution and variability of data, helping to inform decision making, identify outliers, and assess the reliability of statistical inferences.
Use of standard deviation in statistics
The standard deviation is a commonly used statistic in statistics that measures the amount of dispersion or variability in a set of data. It provides a measure of how spread out the values in a dataset are from the mean or average.
By calculating the standard deviation, we can understand the extent to which individual data points deviate from the average. A high standard deviation indicates that the data values are widely dispersed, while a low standard deviation indicates that the data values are closely clustered around the mean.
There are several key uses of standard deviation in statistics:
1. Describing data variability: Standard deviation is used to quantify the amount of spread or dispersion in a dataset. It helps us understand the typical amount by which individual observations deviate from the mean.
2. Comparing groups: Standard deviation allows us to compare the variability of different groups or populations. By examining the standard deviations, we can determine if one group has more variability compared to another.
3. Assessing data reliability: Standard deviation helps assess the reliability or consistency of data. If the standard deviation is relatively low, it suggests that the data points are relatively close to the mean, indicating more reliable measurements.
4. Identifying outliers: Standard deviation can be used to identify outliers or extreme values in a dataset. Observations that fall far outside the range defined by the mean plus or minus a few standard deviations are usually considered outliers.
5. Evaluating statistical significance: In some statistical tests, standard deviation is used to calculate the standard error, which is used to assess the statistical significance of findings. The standard deviation provides an estimate of the variability of the population and is necessary for various statistical analyses.
Overall, standard deviation is a fundamental measure in statistics that helps us understand the spread, variability, and reliability of data. It plays a crucial role in data analysis, hypothesis testing, and drawing meaningful conclusions from datasets.
Limitations and alternatives to standard deviation
Standard deviation is a widely used measure of the dispersion or spread of a dataset. However, it has certain limitations:
1. Sensitive to outliers: Standard deviation is influenced by extreme values or outliers in the dataset. A single outlier can significantly impact the value of standard deviation and may not accurately reflect the spread of the majority of the data.
2. Not robust to non-normal distributions: Standard deviation assumes a normal distribution of data. If the data is skewed or has a heavy-tailed distribution, standard deviation may not provide an accurate representation of the dispersion.
3. Reliant on mean: Standard deviation is based on the mean of the data, which makes it susceptible to the influence of skewed or high-variance data points. If the mean is not reliable or meaningful in a dataset, the standard deviation may not be an appropriate measure of dispersion.
4. Not applicable for categorical data: Standard deviation is a measure of dispersion for continuous and numerical data. It is not applicable for categorical or ordinal data.
Alternatives to standard deviation:
1. Range: The range is the simplest measure of dispersion and represents the difference between the maximum and minimum values in the dataset. It provides a rough estimate of the spread but is sensitive to outliers.
2. Interquartile range (IQR): IQR is a measure of dispersion that focuses on the middle 50% of the data. It is calculated as the difference between the third quartile (75th percentile) and the first quartile (25th percentile). IQR is less sensitive to extreme values and outliers compared to standard deviation.
3. Mean absolute deviation (MAD): MAD is an alternative measure of dispersion that calculates the average absolute difference between each data point and the mean. It is less influenced by extreme values and outliers compared to standard deviation.
4. Variance: Variance is another measure of dispersion that is closely related to standard deviation. It calculates the average squared difference between each data point and the mean. Variance is less intuitive than standard deviation but is more robust to outliers.
5. Coefficient of variation (CV): CV is a relative measure of dispersion calculated by dividing the standard deviation by the mean. It is useful when comparing the variability between datasets with different scales or units.
Topics related to Standard deviation
How To Calculate The Standard Deviation – YouTube
How To Calculate The Standard Deviation – YouTube
Standard Deviation Formula, Statistics, Variance, Sample and Population Mean – YouTube
Standard Deviation Formula, Statistics, Variance, Sample and Population Mean – YouTube
A-Level Maths: L3-11 [Data: Introducing the Variance and Standard Deviation] – YouTube

A-Level Maths: L3-11 [Data: Introducing the Variance and Standard Deviation] – YouTube
Standard deviation (simply explained) – YouTube

Standard deviation (simply explained) – YouTube
Range, variance and standard deviation as measures of dispersion | Khan Academy – YouTube

Range, variance and standard deviation as measures of dispersion | Khan Academy – YouTube
Standard Deviation (Statistics 2021 Paper 2) – YouTube

Standard Deviation (Statistics 2021 Paper 2) – YouTube
How to calculate Standard Deviation and Variance – YouTube
How to calculate Standard Deviation and Variance – YouTube
Standard Deviation vs Standard Error, Clearly Explained!!! – YouTube
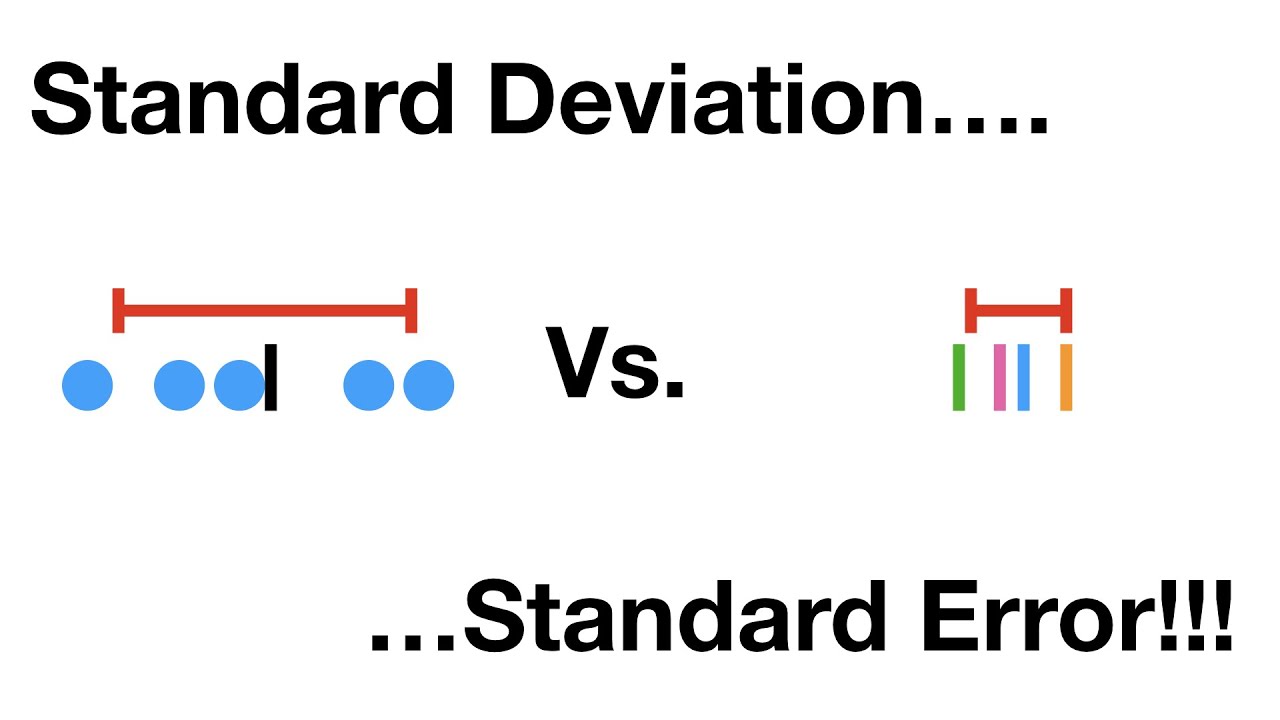
Standard Deviation vs Standard Error, Clearly Explained!!! – YouTube
MEAN, VARIANCE, AND STANDARD DEVIATION FOR UNGROUPED DATA – YouTube
MEAN, VARIANCE, AND STANDARD DEVIATION FOR UNGROUPED DATA – YouTube
Variance and Standard Deviation: Sample and Population Practice Statistics Problems – YouTube
Variance and Standard Deviation: Sample and Population Practice Statistics Problems – YouTube

Peter Scholze is a distinguished German mathematician born on December 11, 1987. Widely recognized for his profound contributions to arithmetic algebraic geometry, Scholze gained international acclaim for his work on perfectoid spaces. This innovative work has significantly impacted the field of mathematics, particularly in the study of arithmetic geometry. He is a leading figure in the mathematical community.