Introduction to Chi-squared distribution
The Chi-squared distribution is a probability distribution that is derived from the sum of the squares of a set of independent standard normal random variables. It is widely used in statistics and has important applications in hypothesis testing and confidence interval estimation.
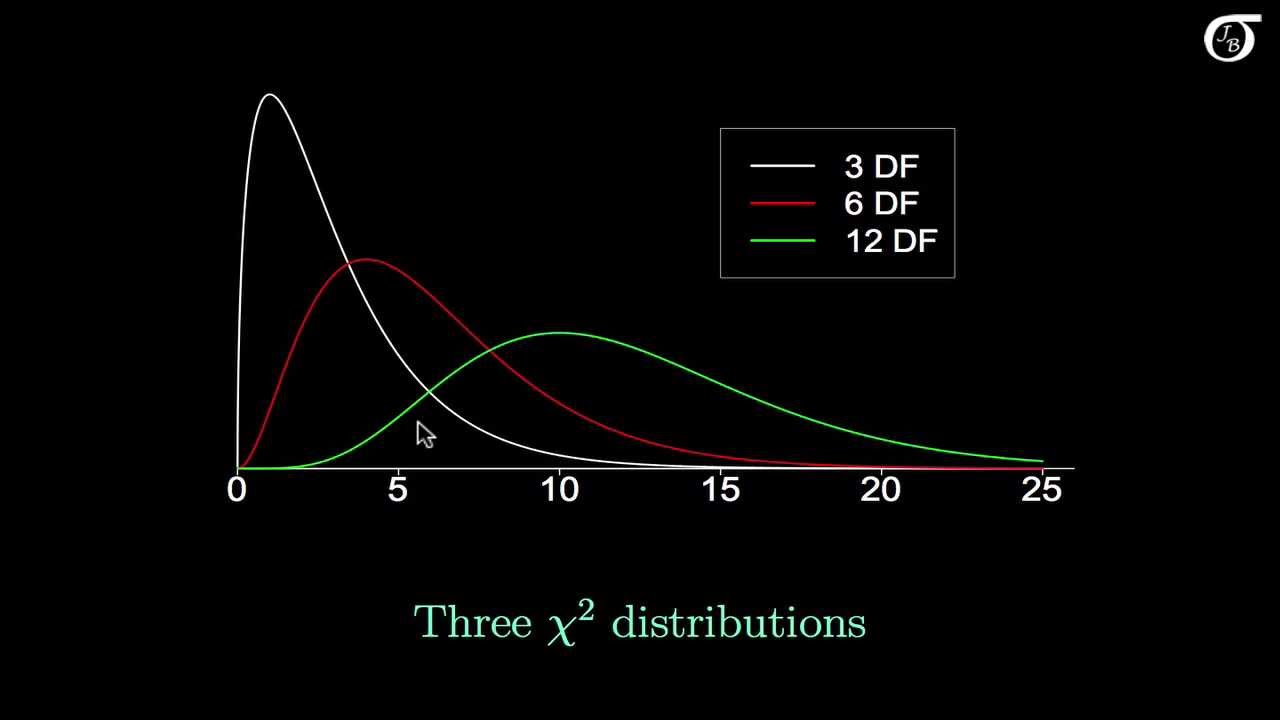
The distribution is characterized by a single parameter called “degrees of freedom,” denoted by ν. The degrees of freedom determine the shape of the distribution and influence its mean and variance. The Chi-squared distribution is only defined for non-negative values and is skewed to the right.
The Chi-squared distribution has several key properties. First, the mean of the distribution is equal to its degrees of freedom, ν. The variance of the distribution is twice the degrees of freedom, 2ν. Additionally, as the degrees of freedom increase, the shape of the distribution approaches a normal distribution.
One of the main applications of the Chi-squared distribution is in hypothesis testing. It is commonly used to assess the goodness of fit between observed and expected frequencies in categorical data. By comparing the observed data to the expected data under a null hypothesis, the Chi-squared test statistic can be calculated and compared to critical values from the Chi-squared distribution to determine the level of significance.
The Chi-squared distribution is also used in constructing confidence intervals for the variance of a normally distributed population when the population mean is unknown. The confidence interval is derived from the Chi-squared distribution using the sample variance and degrees of freedom.
Overall, the Chi-squared distribution plays a fundamental role in statistical inference and is an important tool for analyzing categorical and variance-related problems in various fields such as biology, economics, and social sciences.
Definition and Properties of Chi-squared distribution
The chi-squared distribution is a probability distribution that is commonly used in statistics to analyze categorical data and perform hypothesis testing. It arises from summing the squares of independent standard normal random variables.
The chi-squared distribution is characterized by a single parameter, known as the degrees of freedom (df). The degrees of freedom determine the shape and properties of the distribution. The chi-squared distribution is positively skewed and takes only positive values.
The properties of the chi-squared distribution are as follows:
1. Shape: The shape of the chi-squared distribution is determined by the degrees of freedom, with higher degrees of freedom resulting in a closer approximation to a normal distribution.
2. Mean and Variance: The mean of a chi-squared distribution is equal to its degrees of freedom, while the variance is twice the degrees of freedom.
3. Probability Density Function (PDF): The probability density function of the chi-squared distribution is given by:
f(x; k) = (1/2)^(k/2) * x^(k/2-1) * e^(-x/2) / Γ(k/2)
where x >= 0, k > 0, and Γ denotes the gamma function.
4. Cumulative Distribution Function (CDF): The cumulative distribution function of the chi-squared distribution is given by:
F(x; k) = ∫[0,x] f(t; k) dt
where x >= 0, k > 0.
5. Relationship to Other Distributions: The sum of independent chi-squared random variables follows a chi-squared distribution with the sum of their degrees of freedom. The chi-squared distribution is also related to the gamma distribution, where a chi-squared random variable with k degrees of freedom is equivalent to a gamma random variable with shape parameter k/2 and scale parameter 2.
The chi-squared distribution is often used in statistical hypothesis testing, such as in the chi-squared test for independence or the chi-squared goodness-of-fit test. It is also commonly used to construct confidence intervals and to analyze count data.
Applications of Chi-squared distribution
The Chi-squared distribution is a probability distribution that is widely used in statistics for various applications. Some of the key applications of the Chi-squared distribution are:
1. Goodness of fit test: The Chi-squared test is used to determine whether the observed data follows a certain theoretical distribution. This test examines the discrepancy between observed and expected frequencies for categorical data.
2. Independence test: The Chi-squared test is also used to assess the independence between two variables in a contingency table. It helps in determining whether two categorical variables are related or not.
3. Homogeneity test: The Chi-squared test can be employed to assess the homogeneity or similarity across different populations or groups. This test determines whether the observed frequencies differ significantly across multiple groups.
4. Test of association: The Chi-squared test is utilized to assess the association or relationship between two categorical variables. It helps in determining whether there is a statistically significant association between the variables.
5. Parameter estimation: The Chi-squared distribution is used for parameter estimation in various statistical models. For example, in the context of linear regression, the Chi-squared distribution is used to estimate the variance of errors or residuals.
6. Hypothesis testing: The Chi-squared distribution is commonly used for hypothesis testing in various statistical analyses. It helps in determining whether there is a significant difference between observed and expected frequencies.
7. Reliability analysis: The Chi-squared distribution is used in reliability analysis to assess how well a system or component functions over time. It helps in determining whether there are any significant differences between the observed and expected failure rates.
These are just a few examples of the applications of the Chi-squared distribution. It is a versatile distribution widely used in many fields, including biology, social sciences, finance, and engineering.
Chi-squared test and its significance
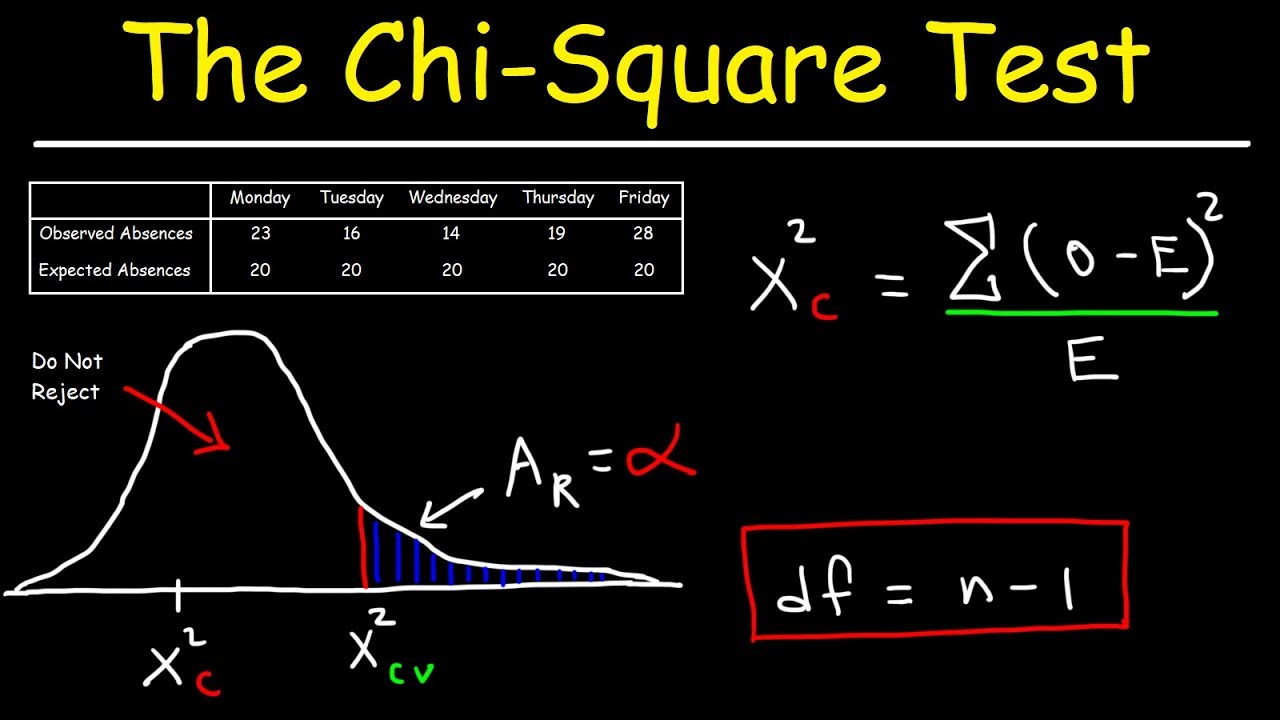
The chi-squared test is a statistical test used to determine whether there is a significant association between two categorical variables. It compares the observed frequencies of each category with the frequencies that would be expected if there was no association between the variables.
The test involves calculating the chi-squared statistic, which measures the difference between the observed and expected frequencies. This statistic follows a chi-squared distribution, which is a probability distribution that depends on the degrees of freedom.
The degrees of freedom for a chi-squared test is determined by the number of categories in each variable. For example, if variable A has 3 categories and variable B has 4 categories, the degrees of freedom would be (3-1) * (4-1) = 6.
To determine the significance of the chi-squared statistic, we compare it to a critical value from the chi-squared distribution. If the chi-squared statistic is greater than the critical value, it suggests that there is a significant association between the variables. In other words, the observed frequencies are significantly different from what would be expected if there was no association.
The p-value, which is the probability of observing a chi-squared statistic as extreme as the one calculated under the null hypothesis, can also be used to determine significance. If the p-value is below a specified significance level (e.g., 0.05), we reject the null hypothesis and conclude that there is a significant association.
In summary, the chi-squared test is a statistical test used to determine the association between two categorical variables. It calculates a chi-squared statistic, which follows a chi-squared distribution. The significance of the test is determined by comparing the statistic to a critical value or by calculating the p-value.
Examples and calculations involving Chi-squared distribution
Sure! Here are a couple of examples and calculations involving the Chi-squared distribution:
Example 1: Let’s say we have a random sample of 100 individuals, and we want to test if the proportion of smokers is different from the proportion of non-smokers in the population. We collect the following data: 40 smokers and 60 non-smokers.
To calculate whether the observed proportion of smokers is significantly different from the expected proportion, we can use a Chi-squared test. The null hypothesis states that there is no difference in the proportions of smokers and non-smokers.
To calculate the Chi-squared statistic, we first need to calculate the expected frequencies under the null hypothesis. Since the expected proportion of smokers would be 0.5 (assuming no difference), the expected number of smokers is 0.5 * 100 = 50, and the expected number of non-smokers is also 0.5 * 100 = 50.
Next, we calculate the Chi-squared statistic using the formula:
X^2 = Σ (Observed – Expected)^2 / Expected
For the smokers, the calculation would be: (40 – 50)^2 / 50 = 4
For the non-smokers, the calculation would be: (60 – 50)^2 / 50 = 4
Adding up both calculations, we get:
X^2 = 4 + 4 = 8
Now, we need to find the corresponding p-value using a Chi-squared distribution table or a statistical software. The degrees of freedom (df) for this test would be (number of categories – 1), so in this case, it is (2 – 1) = 1. Assuming a significance level of 0.05, if the p-value is less than 0.05, we would reject the null hypothesis. Let’s assume the p-value is 0.02.
In this case, since the p-value (0.02) is less than the significance level (0.05), we would reject the null hypothesis and conclude that there is a significant difference between the observed proportion of smokers and the expected proportion.
Example 2: Let’s say we have another scenario where we conduct a survey on the preference for different ice cream flavors among a sample of 500 people. The results show the following frequencies: 100 people prefer chocolate, 250 prefer vanilla, and 150 prefer strawberry.
To determine if the ice cream flavor preferences are distributed equally, we can perform a Chi-squared goodness-of-fit test. The null hypothesis states that the observed frequencies are the same as the expected frequencies (in this case, equal distribution).
To calculate the expected frequencies, we divide the total sample size by the number of categories. In this case, the expected frequencies would be 500 / 3 = 166.67 for each flavor.
Next, we calculate the Chi-squared statistic using the formula:
X^2 = Σ (Observed – Expected)^2 / Expected
For chocolate, the calculation would be: (100 – 166.67)^2 / 166.67 ≈ 23.33
For vanilla, the calculation would be: (250 – 166.67)^2 / 166.67 ≈ 36.11
For strawberry, the calculation would be: (150 – 166.67)^2 / 166.67 ≈ 7.00
Adding up all the calculations, we get:
X^2 ≈ 23.33 + 36.11 + 7.00 ≈ 66.44
To find the corresponding p-value, we need to determine the degrees of freedom (df). In this case, the df is (number of categories – 1), so it is (3 – 1) = 2. Assuming a significance level of 0.05, if the p-value is less than 0.05, we would reject the null hypothesis. Let’s assume the p-value is 0.001.
Since the p-value (0.001) is less than the significance level (0.05), we would reject the null hypothesis and conclude that the ice cream flavor preferences are not distributed equally among the population.
Topics related to Chi-squared distribution
Chi-square distribution introduction | Probability and Statistics | Khan Academy – YouTube

Chi-square distribution introduction | Probability and Statistics | Khan Academy – YouTube
Chi Square Test – YouTube
Chi Square Test – YouTube
BlackFriday23_TT_Video_60s Trailer_Bow Black_Logo@H1-BF@SH1@TL1@BL1_16x9 C-Shape_YouTube_v1_v1 – YouTube

BlackFriday23_TT_Video_60s Trailer_Bow Black_Logo@H1-BF@SH1@TL1@BL1_16x9 C-Shape_YouTube_v1_v1 – YouTube
Understanding the chi-squared distribution – YouTube

Understanding the chi-squared distribution – YouTube
What is the Chi-Squared distribution? Extensive video! – YouTube

What is the Chi-Squared distribution? Extensive video! – YouTube
An Introduction to the Chi-Square Distribution – YouTube
An Introduction to the Chi-Square Distribution – YouTube
Chi-Square Test [Simply explained] – YouTube

Chi-Square Test [Simply explained] – YouTube
Chi Square test – YouTube

Chi Square test – YouTube
The Sample Variance and its Chi Squared Distribution – YouTube

The Sample Variance and its Chi Squared Distribution – YouTube
Chi Squared Test of Independence (IB Maths Studies) – YouTube

Chi Squared Test of Independence (IB Maths Studies) – YouTube

Peter Scholze is a distinguished German mathematician born on December 11, 1987. Widely recognized for his profound contributions to arithmetic algebraic geometry, Scholze gained international acclaim for his work on perfectoid spaces. This innovative work has significantly impacted the field of mathematics, particularly in the study of arithmetic geometry. He is a leading figure in the mathematical community.