Introduction to Hypothesis Testing
Hypothesis testing is a statistical method used to make inferences or decisions about a population based on a sample. It involves making and evaluating hypotheses, which are statements about the characteristics of a population.
In hypothesis testing, the researcher starts with a null hypothesis (H0) and an alternative hypothesis (H1). The null hypothesis assumes that there is no significant difference or relationship between variables in the population, while the alternative hypothesis suggests that there is a significant difference or relationship.
The next step is to collect data from a sample and analyze it using statistical techniques. This involves calculating a test statistic, which measures the extent to which the observed data deviates from what would be expected under the null hypothesis. The test statistic is then compared to a critical value or p-value to determine whether to reject or fail to reject the null hypothesis.
If the test statistic is statistically significant, meaning it falls in the critical region or the p-value is below the significance level (usually set at 0.05), then the null hypothesis is rejected in favor of the alternative hypothesis. This implies that there is evidence to suggest that the variables in the population are not independent or that there is a significant difference between groups.
On the other hand, if the test statistic is not statistically significant, the null hypothesis is not rejected, and there is insufficient evidence to support the alternative hypothesis. However, it is important to note that failing to reject the null hypothesis does not prove that it is true; it simply means that there is not enough evidence to suggest otherwise.
Hypothesis testing is widely used in various fields, including medicine, psychology, economics, and social sciences. It provides a systematic approach to draw conclusions about populations based on sample data and helps researchers make informed decisions and inferences.
Steps in Hypothesis Testing
Hypothesis testing is a statistical procedure used to evaluate if there is enough evidence to support or reject a hypothesis about a population parameter. The process of hypothesis testing usually follows a series of steps:
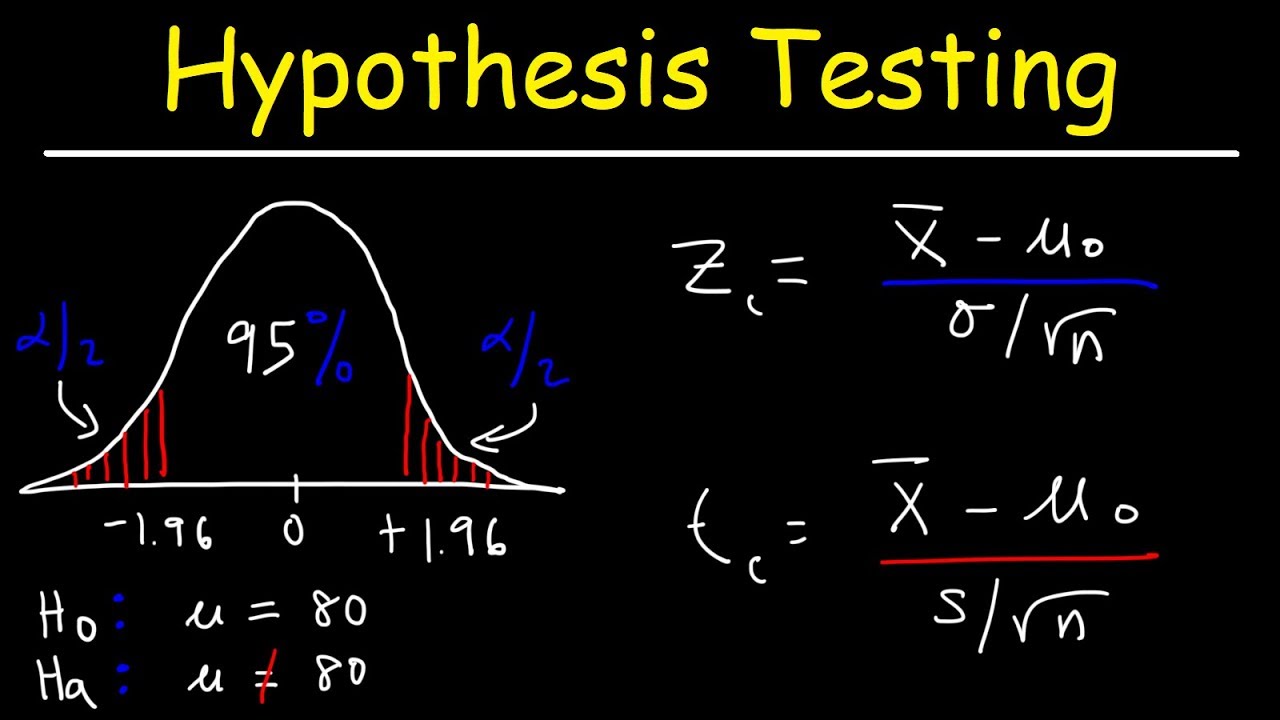
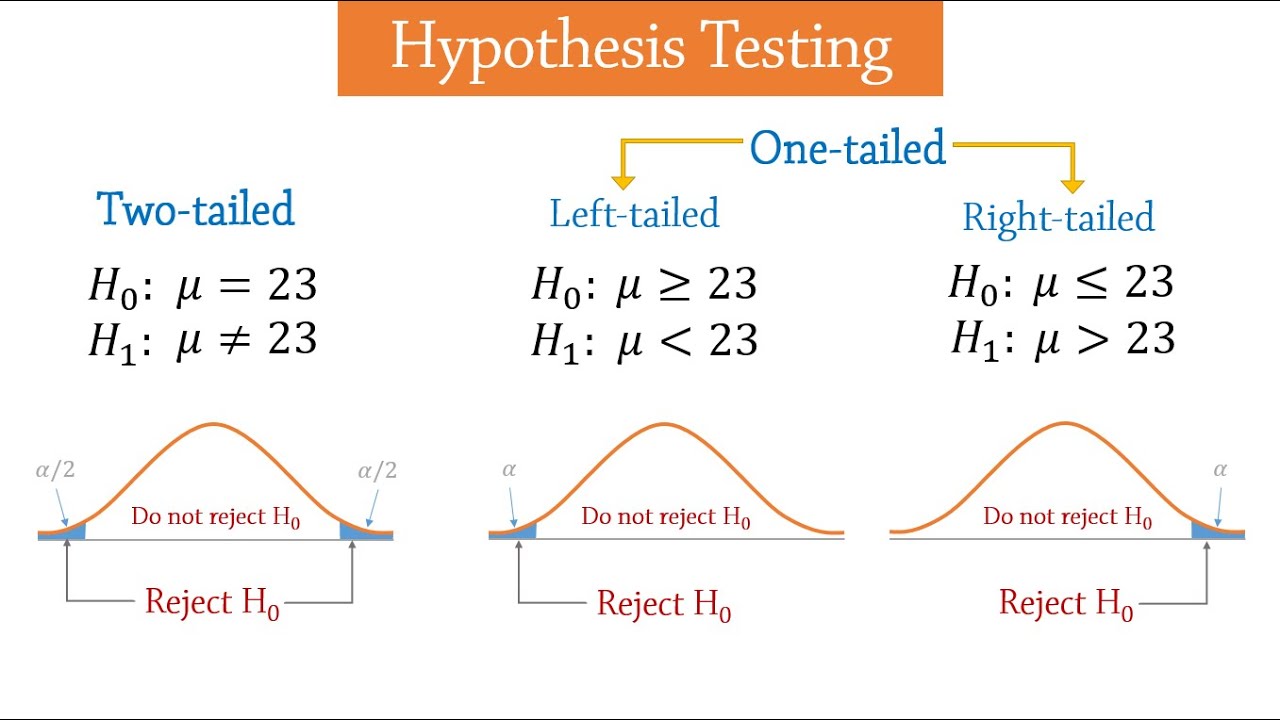
1. State the null hypothesis (H0) and the alternative hypothesis (Ha): The null hypothesis represents the claim that is to be tested, often stating that there is no difference or no relationship between variables. The alternative hypothesis, on the other hand, states the opposite of the null hypothesis, usually proposing that there is a significant difference or relationship.
2. Set the significance level (α): The significance level, often denoted as α, determines the criteria for deciding whether to reject the null hypothesis. It represents the probability of making a Type I error, which is rejecting the null hypothesis when it is actually true. Commonly used significance levels in hypothesis testing are 0.05 (5%) or 0.01 (1%).
3. Collect and analyze the data: Gather the necessary data and analyze it using appropriate statistical techniques. This may include calculating sample means, proportions, standard deviations, or conducting regression analyses, depending on the nature of the study or experiment.
4. Determine the test statistic: Select a test statistic that is appropriate for the type of data and hypothesis being tested. The choice of test statistic may depend on factors such as the sample size, distribution of data, and type of hypothesis being tested.
5. Compute the p-value: The p-value is the probability of obtaining a test statistic as extreme as the one observed, assuming that the null hypothesis is true. It is an indicator of the strength of evidence against the null hypothesis. A smaller p-value suggests stronger evidence against the null hypothesis.
6. Make a decision: Compare the p-value with the pre-determined significance level (α) to decide whether to reject or fail to reject the null hypothesis. If the p-value is less than (or equal to) the significance level, reject the null hypothesis. If the p-value is greater than the significance level, fail to reject the null hypothesis.
7. Draw conclusions: Based on the decision made in step 6, draw conclusions regarding the hypothesis being tested. If the null hypothesis is rejected, it suggests that there is sufficient evidence to support the alternative hypothesis. If the null hypothesis is not rejected, it means that there is not enough evidence to support the alternative hypothesis.
It is important to note that hypothesis testing does not prove the null or alternative hypotheses to be true or false. It only provides statistical evidence to support or reject them based on the available data.
Null and Alternative Hypotheses
In statistical hypothesis testing, the null hypothesis (denoted H0) represents the statement of no effect or no difference between groups, variables, or conditions being compared. The null hypothesis assumes that any observed differences or relationships in the data are due to random chance or sampling error.
On the other hand, the alternative hypothesis (denoted H1 or Ha) represents the statement that contradicts the null hypothesis. It suggests that there is a significant effect or difference between the groups, variables, or conditions being compared, beyond what could be expected by chance.
The purpose of hypothesis testing is to assess whether the evidence from the data is strong enough to reject or fail to reject the null hypothesis in favor of the alternative hypothesis. The statistical analysis used in this process involves calculating test statistics and p-values to evaluate the strength of the evidence.
If the p-value is below a pre-determined significance level (usually 0.05 or 0.01), there is strong evidence to reject the null hypothesis in favor of the alternative hypothesis. This indicates that the observed differences or relationships are unlikely to be due to chance alone.
On the other hand, if the p-value is above the significance level, there is not enough evidence to reject the null hypothesis. This means that the observed differences or relationships could reasonably be explained by sampling error, and that there is no significant effect or difference.
It is important to note that failing to reject the null hypothesis does not prove that there is no effect or difference, but rather indicates that there is not enough evidence to support the alternative hypothesis.
Type I and Type II Errors
Type I and Type II errors are two types of errors that can occur during hypothesis testing.
Type I error, also known as a false positive, occurs when the null hypothesis is rejected when it is actually true. In other words, Type I error is the incorrect rejection of a true null hypothesis. This error is typically denoted by the significance level (alpha) of the hypothesis test. A lower significance level reduces the chances of committing a Type I error but increases the chances of committing a Type II error.
Type II error, also known as a false negative, occurs when the null hypothesis is not rejected when it is actually false. In other words, Type II error is the failure to reject a false null hypothesis. This error occurs when the alternative hypothesis is true, but the sample data does not provide sufficient evidence to reject the null hypothesis.
The probabilities of Type I and Type II errors are inversely related. As the probability of committing a Type I error decreases, the probability of committing a Type II error increases, and vice versa. Researchers must consider the consequences of both types of errors and select an appropriate significance level to control the balance between these two errors.
Hypothesis testing is a statistical procedure used to make inferences about a population based on a sample. It involves formulating a null and alternative hypothesis, collecting sample data, and making a decision about the null hypothesis based on the sample evidence.
The null hypothesis (H0) represents the status quo or the default assumption. The alternative hypothesis (Ha) is the research hypothesis or the claim that the researcher wants to support. The goal of hypothesis testing is to gather enough evidence to either reject the null hypothesis in favor of the alternative hypothesis or fail to reject the null hypothesis.
Hypothesis testing involves calculating a test statistic, such as a t-statistic or z-statistic, and determining the probability of obtaining the observed sample results assuming that the null hypothesis is true. This probability is called the p-value. If the p-value is less than the predetermined significance level (alpha), the null hypothesis is typically rejected. Otherwise, if the p-value is greater than alpha, the null hypothesis is not rejected.
Hypothesis testing allows researchers to draw conclusions about the population based on sample data while considering the risk of committing Type I and Type II errors. It is an essential tool in statistical analysis for making informed decisions and drawing meaningful conclusions from data.
Examples and Applications of Hypothesis Testing
Hypothesis testing is a statistical tool used to make inferences and draw conclusions about a population based on data from a sample. It involves setting up a null hypothesis and an alternative hypothesis and then testing the evidence against the null hypothesis to determine if there is enough statistical evidence to reject it.
Here are some examples and applications of hypothesis testing:
1. Medical Research: Hypothesis testing is widely used in medical research to test the effectiveness of new drugs or treatments. For example, a researcher may hypothesize that a new drug reduces blood pressure in patients. The null hypothesis would state that there is no difference in blood pressure before and after taking the drug, and the alternative hypothesis would state that there is a significant reduction. By conducting a hypothesis test using appropriate statistical tests, the researcher can determine if there is enough evidence to support the alternative hypothesis and conclude that the drug is effective.
2. Quality Control: Hypothesis testing is commonly used in quality control to ensure that products or processes meet certain standards. For instance, a manufacturing company might test a sample of its products to determine if they meet a specified weight requirement. The null hypothesis would state that the mean weight of the products is equal to the specified weight, while the alternative hypothesis would state that the mean weight is not equal. By conducting a hypothesis test, the company can decide whether to accept or reject the null hypothesis and take necessary actions to improve the quality of their products.
3. Market Research: Hypothesis testing is utilized in market research to analyze consumer behavior and preferences. For example, a company might test whether a new advertising campaign has had a significant impact on brand recognition. The null hypothesis would state that there is no difference in brand recognition before and after the campaign, while the alternative hypothesis would state that there is a significant increase. By conducting a hypothesis test, the company can evaluate the effectiveness of their marketing efforts and make informed decisions for future campaigns.
4. Social Sciences: Hypothesis testing is widely used in social sciences such as psychology, sociology, and economics to explore different hypotheses and theories. For instance, a psychologist might test the hypothesis that people who practice mindfulness meditation have lower levels of stress. The null hypothesis would state that there is no difference in stress levels between individuals who practice mindfulness meditation and those who do not. By conducting a hypothesis test, the psychologist can gather evidence to support or reject the hypothesis and contribute to the existing body of knowledge in the field.
These are just a few examples of the numerous applications of hypothesis testing. It is an essential tool in the field of statistics that allows researchers and analysts to make evidence-based decisions and draw meaningful conclusions.
Topics related to Hypothesis testing
Hypothesis Testing Problems – Z Test & T Statistics – One & Two Tailed Tests 2 – YouTube
Hypothesis Testing Problems – Z Test & T Statistics – One & Two Tailed Tests 2 – YouTube
A-Level Maths: O2-05 [Binomial Hypothesis Testing: Two-Tail Example 1] – YouTube

A-Level Maths: O2-05 [Binomial Hypothesis Testing: Two-Tail Example 1] – YouTube
Introduction to Vectors – YouTube

Introduction to Vectors – YouTube
Part 1: Hypothesis Testing| Null & Alternative Hypothesis| Level of Significance | Type-I & II Error – YouTube

Part 1: Hypothesis Testing| Null & Alternative Hypothesis| Level of Significance | Type-I & II Error – YouTube
Part 2: Parametric & Non Parametric Tests| Details of z Test, t Test, F Test, ANOVA, Chi Square Test – YouTube

Part 2: Parametric & Non Parametric Tests| Details of z Test, t Test, F Test, ANOVA, Chi Square Test – YouTube
Hypothesis Testing – Introduction – YouTube
Hypothesis Testing – Introduction – YouTube
Math Made Easy by StudyPug! F3.0.0 – YouTube

Math Made Easy by StudyPug! F3.0.0 – YouTube
Hypothesis Testing Full concept in Hindi | statistics | Engineering Maths 4 Lectures – YouTube

Hypothesis Testing Full concept in Hindi | statistics | Engineering Maths 4 Lectures – YouTube
Intro to Hypothesis Testing in Statistics – Hypothesis Testing Statistics Problems & Examples – YouTube

Intro to Hypothesis Testing in Statistics – Hypothesis Testing Statistics Problems & Examples – YouTube
Questions based on Testing of Hypothesis – YouTube

Questions based on Testing of Hypothesis – YouTube

Peter Scholze is a distinguished German mathematician born on December 11, 1987. Widely recognized for his profound contributions to arithmetic algebraic geometry, Scholze gained international acclaim for his work on perfectoid spaces. This innovative work has significantly impacted the field of mathematics, particularly in the study of arithmetic geometry. He is a leading figure in the mathematical community.