Introduction to Normal Distribution
Normal distribution, also known as Gaussian distribution, is a statistical concept used to model a wide range of natural processes and phenomena. It is one of the most important probability distributions in statistics and is often referred to as the bell curve due to its characteristic shape.
A normal distribution is defined by its mean (μ) and standard deviation (σ). The mean represents the central tendency of the distribution, indicating where the peak or center of the curve lies. The standard deviation indicates the spread or dispersion of the data, providing information about how closely the data points are clustered around the mean.
The shape of a normal distribution is symmetric, with the highest point occurring at the mean. The curve gradually tapers off on both sides, mirroring the equal probabilities of events occurring in either direction from the mean. The area under the curve represents the probability of events occurring within different ranges of values.
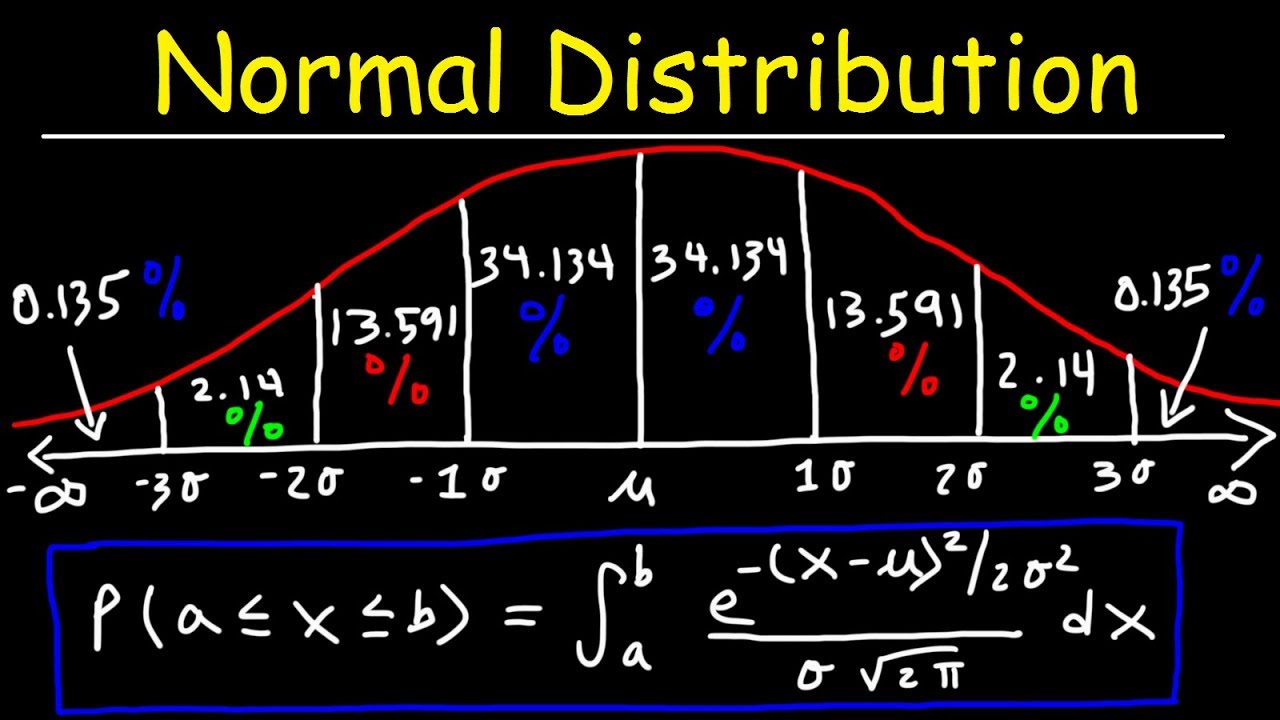
One of the key properties of a normal distribution is the 68-95-99.7 rule, also known as the empirical rule. According to this rule, approximately 68% of the data falls within one standard deviation of the mean, about 95% falls within two standard deviations, and approximately 99.7% falls within three standard deviations.
Normal distribution is used extensively in various fields, including statistics, economics, physics, biology, and social sciences. It provides a framework for analyzing and interpreting data, making predictions, and conducting hypothesis testing. Additionally, many statistical techniques and tests assume that the data follow a normal distribution, making it a fundamental concept in statistical analysis.
In conclusion, normal distribution is a fundamental concept in statistics, representing a symmetric bell-shaped curve with a well-defined mean and standard deviation. It is widely used to model and analyze various natural processes and phenomena, providing a valuable tool for understanding and interpreting data.
Definition and Characteristics of Normal Distribution
Normal distribution, also known as the Gaussian distribution or bell curve, is a common probability distribution that is symmetrically shaped and has a bell-shaped curve when graphically represented. It is characterized by a smooth, continuous, and symmetrical distribution of data.
The defining characteristics of a normal distribution are as follows:
1. Symmetry: The normal distribution is symmetrical around its mean, meaning that the left and right halves of the curve are mirror images of each other.
2. Bell-shaped curve: The distribution follows a bell-shaped curve, which means that the majority of the data falls near the mean and gradually tapers off towards the extremes.
3. Mean, median, and mode are equal: In a normal distribution, the mean, median, and mode are all equal and occupy the center of the distribution.
4. Empirical Rule: The distribution follows the empirical rule, also known as the 68-95-99.7 rule. This rule states that approximately 68% of the data falls within one standard deviation of the mean, 95% falls within two standard deviations, and 99.7% falls within three standard deviations.
5. Skewness and kurtosis: The normal distribution has zero skewness, meaning that it is not skewed to the left or right. It also has a kurtosis value of 3, which indicates that it has a standard, or normal, curve compared to other distributions.
6. Known parameters: The normal distribution is fully defined by its mean (μ) and standard deviation (σ). These parameters determine the shape, location, and spread of the distribution.
The normal distribution is commonly used in statistics and probability theory as it approximates many natural phenomena and real-world data, such as heights and weights of individuals, exam scores, and errors in measurement. It serves as a foundation for various statistical tests, including hypothesis testing and confidence interval estimation.
Properties and Features of Normal Distribution
Properties of Normal Distribution:
1. Bell-shaped curve: The normal distribution is characterized by a symmetrical bell-shaped curve. It is smooth, unimodal, and symmetric around its mean.
2. Mean, Median, and Mode: The mean, median, and mode of a normal distribution are all equal and located at the center of the distribution. This is the location with the highest probability.
3. Continuous and unbounded: The normal distribution is a continuous probability distribution, meaning that it can take on any real value. It is unbounded on both sides and extends infinitely in both directions.
4. Standard Deviation: The spread or dispersion of a normal distribution is determined by its standard deviation. The curve is narrower when the standard deviation is smaller and wider when the standard deviation is larger.
5. Asymptotic tails: The tails of a normal distribution approach but never touch the x-axis. This means that there is a small but non-zero probability of values occurring at extreme ends of the distribution.
6. Empirical Rule: The empirical rule, also known as the 68-95-99.7 rule, states that approximately 68% of the data falls within one standard deviation of the mean, about 95% falls within two standard deviations, and roughly 99.7% falls within three standard deviations.
Features of Normal Distribution:
1. Skewness and Kurtosis: Normal distribution is perfectly symmetrical with zero skewness. It has a kurtosis of 3, which means it has a moderate peak compared to other distributions.
2. Central Limit Theorem: The normal distribution has a special significance in statistics due to the central limit theorem. According to this theorem, the average of a large number of independent and identically distributed random variables will approximately follow a normal distribution.
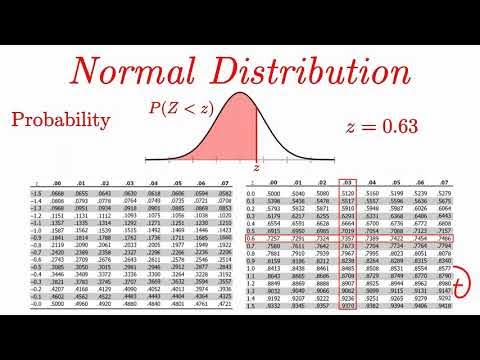
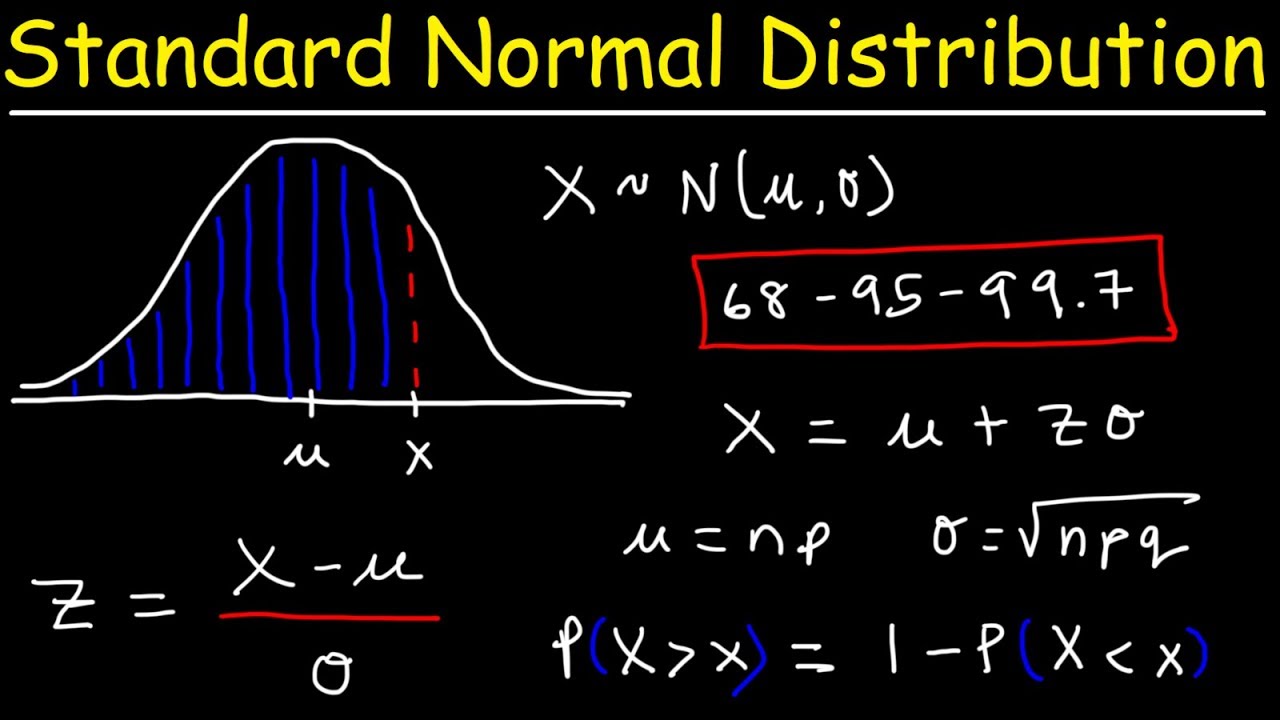
3. Z-scores: Z-scores, also known as standard scores, are used to measure how many standard deviations away a value is from the mean in a normal distribution. They are commonly used to assess the relative standing of an observation within the distribution.
4. Probability Density Function (PDF): The probability density function of a normal distribution describes the likelihood of a random variable taking on a specific value. It is represented by a symmetric bell-shaped curve equation.
5. Standard Normal Distribution: A standard normal distribution is a special case of the normal distribution with a mean of 0 and a standard deviation of 1. It serves as a reference for converting data from any normal distribution to a standard normal distribution using z-scores.
6. Applications: The normal distribution is widely used in various fields due to its simple and predictable nature. It is commonly applied in finance, social sciences, quality control, and manufacturing, where variables tend to cluster around a mean and show symmetrical behavior.
Applications of Normal Distribution in Mathematics
The normal distribution, also known as the Gaussian distribution, is a probability distribution that is widely used in mathematics and statistics. It is characterized by a bell-shaped curve and has several applications in various fields. Here are some applications of the normal distribution in mathematics:
1. Central Limit Theorem: One of the most important applications of the normal distribution is in the Central Limit Theorem. This theorem states that, regardless of the shape of the population distribution, the distribution of the sample means approaches a normal distribution as the sample size increases. This result has numerous implications in statistics, as it allows for the estimation of population parameters and hypothesis testing.
2. Statistical Inference: The normal distribution is commonly used in statistical inference. Parameters such as the mean and standard deviation can be estimated using methods like maximum likelihood estimation. Additionally, hypothesis tests, confidence intervals, and prediction intervals often assume a normal distribution for the underlying population.
3. Z-scores: In statistical analysis, z-scores are used to standardize a random variable using the mean and standard deviation of a normal distribution. This allows for easier comparison and interpretation of data. Z-scores are used in fields such as quality control, where they help identify outliers or deviations from expected values.
4. Measurement Error: In many scientific experiments, measurements are subject to random error. The normal distribution is commonly used to model this measurement error because it is convenient and intuitive. This is particularly useful in regression analysis, where the normal distribution is often used for the residuals.
5. Sampling Distributions: Sampling distributions, which describe the distribution of sample statistics calculated from different samples drawn from the same population, often follow a normal distribution. This allows for the calculation of confidence intervals and hypothesis tests.
6. Financial Mathematics: The normal distribution is frequently used in financial mathematics. Asset prices, returns, and volatility often exhibit a normal distribution due to the Central Limit Theorem and assumptions made in financial modeling. This allows for the calculation of risk measures, option pricing, and portfolio optimization.
Overall, the normal distribution has a wide range of applications in mathematics, particularly in statistics and probability theory. Its simplicity and robustness make it a valuable tool in analyzing and interpreting data.
Conclusion
In conclusion, the normal distribution is a probability distribution that is widely used in statistics and probability theory. It is characterized by a symmetric bell-shaped curve, with the majority of data clustered around the mean. The properties of the normal distribution make it particularly useful for modeling and analyzing continuous random variables in various fields, such as finance, psychology, and natural sciences. The central limit theorem also states that the sum or average of a large number of independent and identically distributed random variables will follow a normal distribution, further highlighting its importance in statistical inference. Overall, the normal distribution is a fundamental concept in statistics and plays a crucial role in many statistical analyses and predictions.
Topics related to Normal distribution
Normal Distribution EXPLAINED with Examples – YouTube
Normal Distribution EXPLAINED with Examples – YouTube
The Normal Distribution, Clearly Explained!!! – YouTube
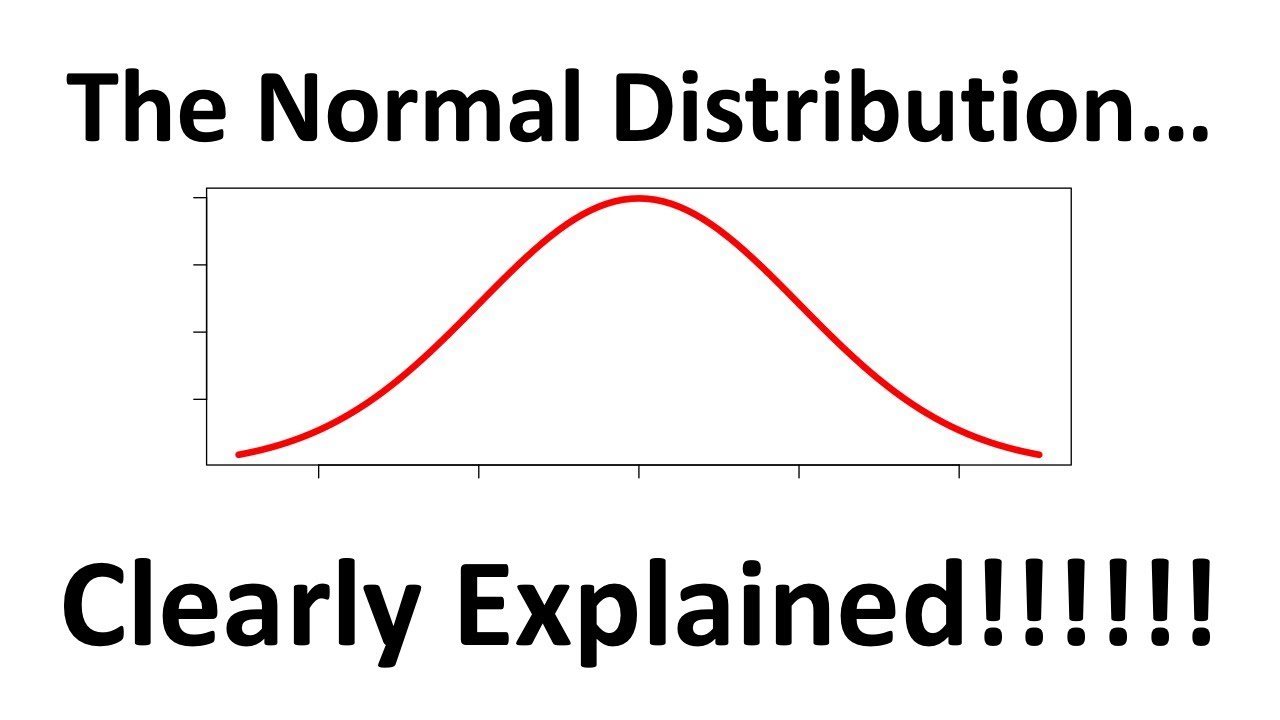
The Normal Distribution, Clearly Explained!!! – YouTube
Holiday23_TT_Video_60s Trailer_Bow Black_Logo@H1@SH1@TL1@BL1_9x16_YouTube_v1_v1 – YouTube

Holiday23_TT_Video_60s Trailer_Bow Black_Logo@H1@SH1@TL1@BL1_9x16_YouTube_v1_v1 – YouTube
Standard Normal Distribution Tables, Z Scores, Probability & Empirical Rule – Stats – YouTube
Standard Normal Distribution Tables, Z Scores, Probability & Empirical Rule – Stats – YouTube
A-Level Maths: N2-01 Normal Distribution: Introducing the Bell Curve – YouTube

A-Level Maths: N2-01 Normal Distribution: Introducing the Bell Curve – YouTube
A-Level Maths: N2-02 Normal Distribution: Introducing the Normal Distribution – YouTube

A-Level Maths: N2-02 Normal Distribution: Introducing the Normal Distribution – YouTube
Math Made Easy by StudyPug! F3.0.0ve – YouTube

Math Made Easy by StudyPug! F3.0.0ve – YouTube
Normal Distribution & Probability Problems – YouTube
Normal Distribution & Probability Problems – YouTube
Normal Distribution: Calculating Probabilities/Areas (z-table) – YouTube
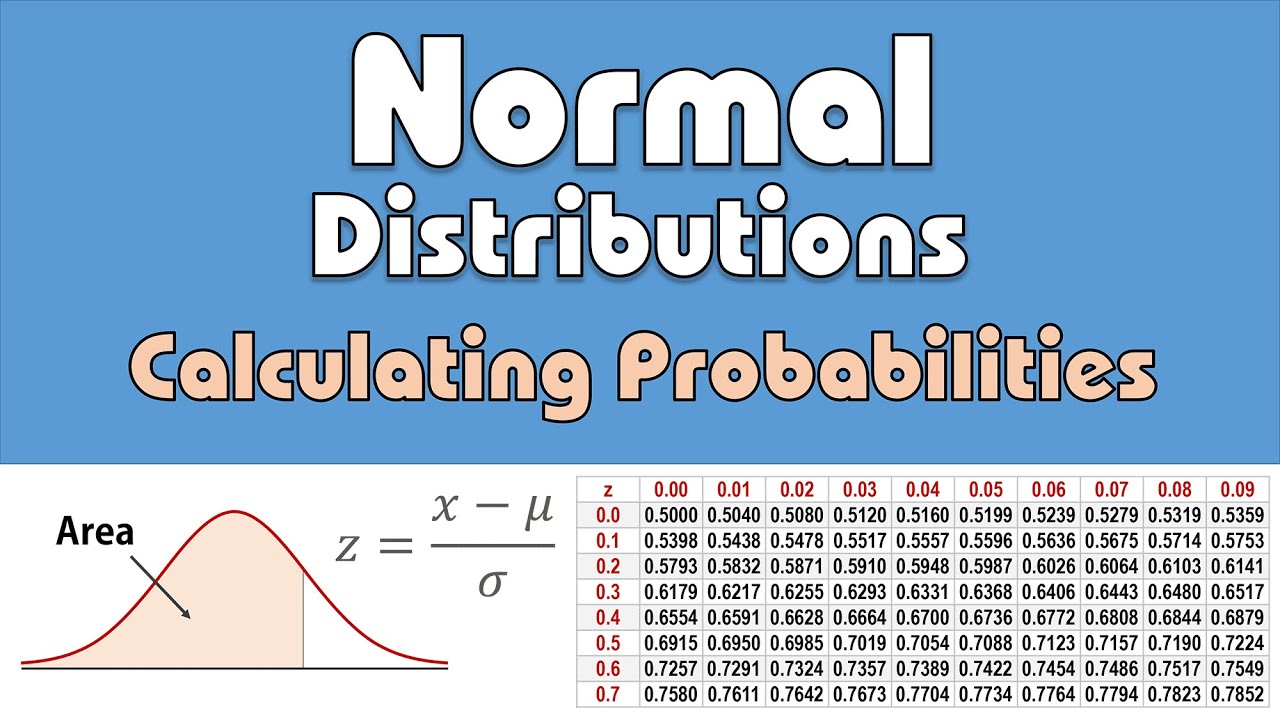
Normal Distribution: Calculating Probabilities/Areas (z-table) – YouTube
Normal Distribution | Probability | Mathematics | MMS | BCom | Engineering – YouTube

Normal Distribution | Probability | Mathematics | MMS | BCom | Engineering – YouTube

Peter Scholze is a distinguished German mathematician born on December 11, 1987. Widely recognized for his profound contributions to arithmetic algebraic geometry, Scholze gained international acclaim for his work on perfectoid spaces. This innovative work has significantly impacted the field of mathematics, particularly in the study of arithmetic geometry. He is a leading figure in the mathematical community.