Introduction to Probability Density Function (PDF)
A probability density function (PDF) is a mathematical function used in probability theory to describe the likelihood of different values occurring in a continuous random variable. It provides a way to understand the probability distribution of a random variable by assigning probabilities to different intervals or ranges of values.
Unlike discrete probability distributions, which are associated with discrete random variables (such as the number of heads obtained when flipping a coin), PDFs are used for continuous random variables that can take on any value within a certain range. Examples of continuous random variables include height, weight, time, and temperature.
The PDF is defined in such a way that the integral of the function over a specific range gives the probability of the random variable falling within that particular range. This means that the area under the curve of the PDF represents the total probability of all possible outcomes.
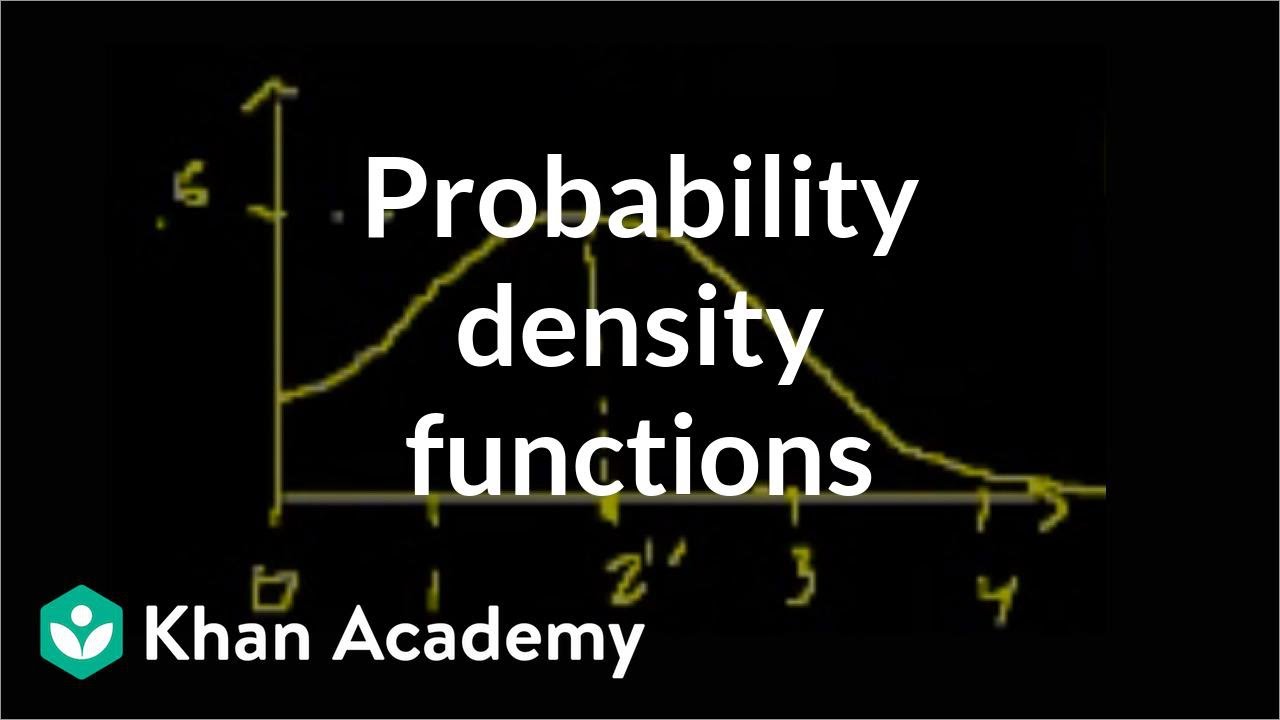
The PDF is often represented by a curve that describes the shape of the probability distribution. The height of the curve at each point indicates the relative likelihood of the random variable taking on that specific value. The total area under the curve is always equal to 1, as the probabilities of all possible outcomes must add up to 1.
The properties of a PDF include non-negativity, meaning that the probability density is always non-negative, and integration over the entire range equals 1, ensuring that the total probability sums to 1.
PDFs are an essential tool in statistics and probability theory, as they allow for the calculation of probabilities, determining the expected value and variance of a random variable, and conducting statistical inference based on data. They provide a way to analyze and understand the distribution of data in real-world applications.
Definition and Properties of Probability Density Function
Definition:
A Probability Density Function (PDF) is a mathematical function that describes the likelihood of a random variable taking on a specific value or falling within a specific range of values. The PDF represents the continuous probability distribution of a continuous random variable.
Properties:
1. Non-negative values: The PDF is always non-negative, meaning that the value of the function at any point is greater than or equal to zero.
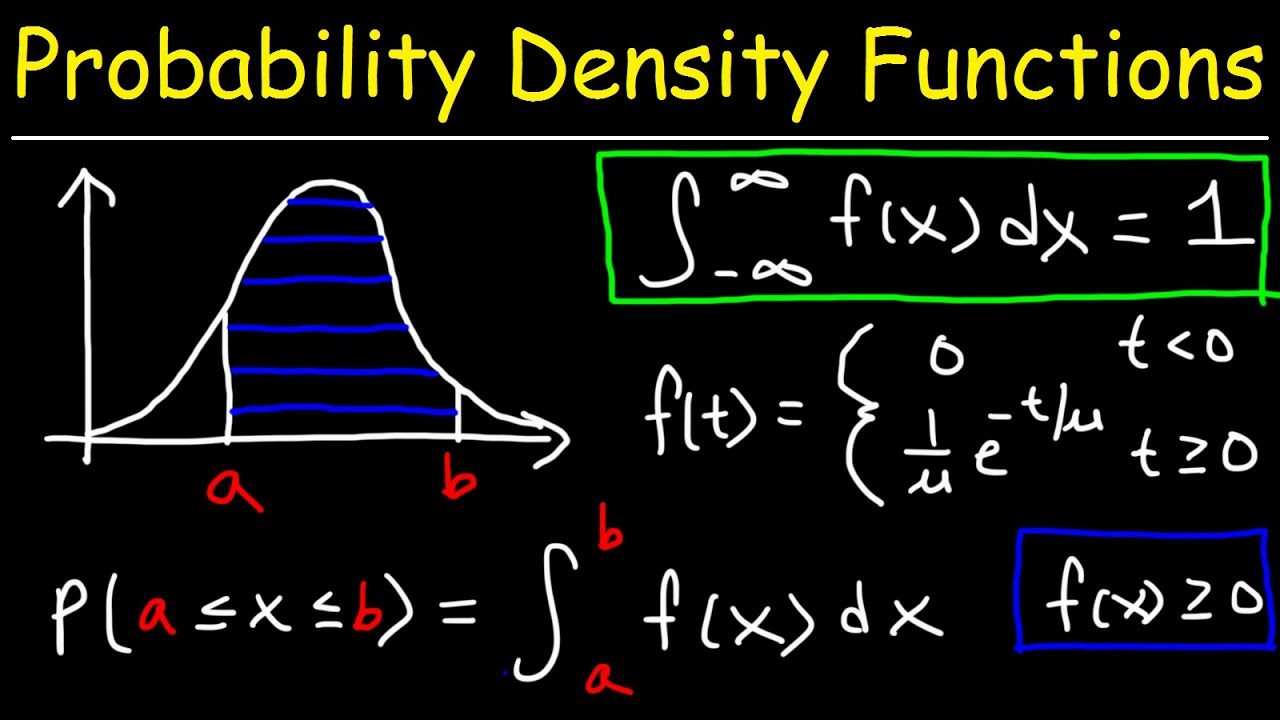
2. Integration over the entire range equals one: The PDF must integrate to one over its entire range of values. This reflects the fact that the total probability of all possible outcomes must be equal to one.
3. Area under the curve represents probability: The area under the curve of the PDF over a specific range of values represents the probability that the random variable falls within that range. Therefore, the PDF can be used to determine the likelihood of different events occurring.
4. Measures relative likelihood: The height of the PDF at a specific point represents the relative likelihood of the random variable taking on that value. A higher peak indicates a higher probability at that point.
5. Derivative gives the Cumulative Distribution Function (CDF): The derivative of the PDF with respect to the random variable gives the Cumulative Distribution Function (CDF), which provides the probability that the random variable takes on a value less than or equal to a specific point.
6. Different PDFs for different distributions: Different probability distributions have their own corresponding PDFs, each with their own unique mathematical form and properties. Examples include the normal distribution, exponential distribution, and uniform distribution.
It is important to note that the PDF only applies to continuous random variables, which can take on any value within a certain range. For discrete random variables, the corresponding concept is the Probability Mass Function (PMF).
Applications of Probability Density Function
The probability density function (PDF) is a concept used in probability theory and statistics to describe the likelihood of a continuous random variable taking on a particular value. It has numerous applications in various fields. Here are some examples:
1. Statistical Data Analysis: PDFs are commonly used in analyzing and modeling data. By determining the PDF for a given dataset, statisticians can better understand its underlying distribution and make inferences about the data.
2. Risk Assessment: In finance and insurance, PDFs help assess and model risk. By estimating the PDF of a financial variable such as stock prices or returns, analysts can calculate probabilities of certain events (e.g., extreme losses) and make risk management decisions.
3. Product Quality Assurance: In manufacturing processes, PDFs can be used to assess the quality of products. By analyzing the PDF of key process parameters, such as dimensions or material properties, manufacturers can monitor quality control and identify deviations from desired standards.
4. Signal Processing: In electronics and telecommunications, PDFs assist in analyzing and manipulating signals. By characterizing the PDF of a signal, engineers can optimize signal processing algorithms, such as noise reduction techniques or data compression.
5. Machine Learning: PDFs play a vital role in probabilistic modeling and inference in machine learning. They are used to model the likelihood of observations given a set of parameters, allowing for statistical learning and predictive modeling.
6. Environmental Studies: PDFs are used to model environmental variables. For example, in climate science, PDFs can describe variables like rainfall patterns, temperature distributions, or sea-level rise, aiding in climate change prediction and impact assessment.
7. Engineering Design: In engineering, PDFs help analyze and design systems that exhibit variability. By incorporating PDFs in design calculations, engineers can account for uncertainties and make reliable design decisions that consider the variations in system parameters.
These are just a few examples of the wide range of applications for probability density functions. In each case, the PDF allows for a quantitative understanding of probability and helps guide decision-making in various domains.
Calculation and Interpretation of Probability Density Function
The probability density function (PDF) is a function that describes the probability distribution of a continuous random variable. It assigns probabilities to different intervals of values, rather than individual values, as is the case with discrete random variables. The PDF is defined such that the probability of a random variable falling within a specific interval can be calculated by integrating the PDF over that interval.
To calculate and interpret the PDF, the following steps can be followed:
1. Identify the random variable: Determine the continuous random variable of interest. For example, let’s consider the weight of apples in a box.
2. Determine the range of the random variable: Define the range of values that the random variable can take. For example, suppose the weight of apples can range from 0 to 500 grams.
3. Establish the PDF function: Determine the mathematical function that describes the probability distribution of the random variable. The PDF function should satisfy two conditions: it must be non-negative for all possible values of the random variable, and when integrated over its entire range, the result should be equal to 1. The specific form of the PDF will depend on the characteristics of the distribution being modeled. For example, if the weight of apples follows a normal distribution, the PDF could be described by the bell-shaped curve of the normal distribution.
4. Calculate probabilities: Once the PDF function is established, probabilities can be calculated by integrating the PDF over specific intervals. For example, to determine the probability that an apple selected at random weighs between 200 and 300 grams, you would calculate the integral of the PDF function from 200 to 300.
Interpreting the PDF:
– The height of the PDF curve at a specific point represents the relative likelihood of the random variable taking on that value. Higher points on the curve indicate higher likelihoods.
– The total area under the curve represents the probability of the random variable falling within the defined range. Since the integral of the PDF over its entire range is equal to 1, the area under the curve is always 1.
– The PDF provides information about the shape of the probability distribution. For example, a symmetrical PDF indicates a symmetric distribution, while skewed PDFs indicate asymmetry in the distribution. Different types of distributions can have different shapes, such as the normal distribution being bell-shaped or the exponential distribution being positively skewed.
Comparison with other Probability Functions
The probability density function (PDF) is a fundamental concept in probability theory that describes the probability distribution of a continuous random variable. It is often compared to other probability functions such as cumulative distribution function (CDF) and probability mass function (PMF).
1. Cumulative Distribution Function (CDF): The CDF gives the probability that a random variable takes a value less than or equal to a given value. It is the integral of the PDF and provides a complete picture of the probabilities associated with the random variable. In contrast, the PDF only provides the relative likelihood of different values but does not give the probabilities themselves.
2. Probability Mass Function (PMF): The PMF is associated with discrete random variables and gives the probability that a random variable takes a specific value. Unlike the PDF, which is defined for continuous random variables, the PMF is defined for discrete random variables. The sum of all PMF values adds up to 1, which represents the total probability of all possible outcomes.
3. Relationship between PDF and PMF: When dealing with continuous random variables, the PDF serves a similar purpose to the PMF in that it represents the likelihood of different values. However, while the PMF gives probabilities for specific values, the PDF represents probabilities over an interval or range of values. The probability of a specific value from a PDF is therefore zero, as the probability is defined over an infinitesimally small range.
4. Comparison of shapes: PDFs can have different shapes depending on the underlying probability distribution. Common shapes include bell-shaped (e.g., normal distribution), skewed (e.g., exponential distribution), and uniform. Different shapes indicate different probabilities for different values of the random variable, allowing for the visualization of key characteristics such as mean and variance.
In summary, the PDF is a probability function that describes the likelihood of different values for continuous random variables. It is typically compared to the CDF and PMF, which are used for different types of random variables and provide different information about probabilities. Understanding these different probability functions is crucial for analyzing and interpreting data in various fields, including statistics and machine learning.
Topics related to Probability density function (PDF)
Probability Distribution Functions (PMF, PDF, CDF) – YouTube

Probability Distribution Functions (PMF, PDF, CDF) – YouTube
Probability density functions | Probability and Statistics | Khan Academy – YouTube
Probability density functions | Probability and Statistics | Khan Academy – YouTube
Angle Properties Point Lines and Angles. – YouTube

Angle Properties Point Lines and Angles. – YouTube
What is a Probability Density Function (pdf)? ("by far the best and easy to understand explanation") – YouTube

What is a Probability Density Function (pdf)? ("by far the best and easy to understand explanation") – YouTube
Probability Density Functions – YouTube
Probability Density Functions – YouTube
PROBABILITY DENSITY FUNCTION (PDF) PART -1 – YouTube

PROBABILITY DENSITY FUNCTION (PDF) PART -1 – YouTube
Probability Density Function (PDF)-Properties of PDF (Random Variables and Probability Distribution) – YouTube

Probability Density Function (PDF)-Properties of PDF (Random Variables and Probability Distribution) – YouTube
Cumulative Distribution Functions and Probability Density Functions – YouTube

Cumulative Distribution Functions and Probability Density Functions – YouTube
Continuous Random Variables: Probability Density Functions – YouTube

Continuous Random Variables: Probability Density Functions – YouTube
Probability Density Functions (1 of 7: Meeting the conditions) – YouTube

Probability Density Functions (1 of 7: Meeting the conditions) – YouTube

Peter Scholze is a distinguished German mathematician born on December 11, 1987. Widely recognized for his profound contributions to arithmetic algebraic geometry, Scholze gained international acclaim for his work on perfectoid spaces. This innovative work has significantly impacted the field of mathematics, particularly in the study of arithmetic geometry. He is a leading figure in the mathematical community.